SimTIVA Manual v2.0
Welcome!
This is the user manual for SimTIVA.app, a web app to simulate target-controlled infusion (TCI).
This manual contains 10 chapters: the first two chapters cover the basic functionalities to help you get started. We have translated the manual into multiple languages. Video tutorials are coming soon.
Getting Started
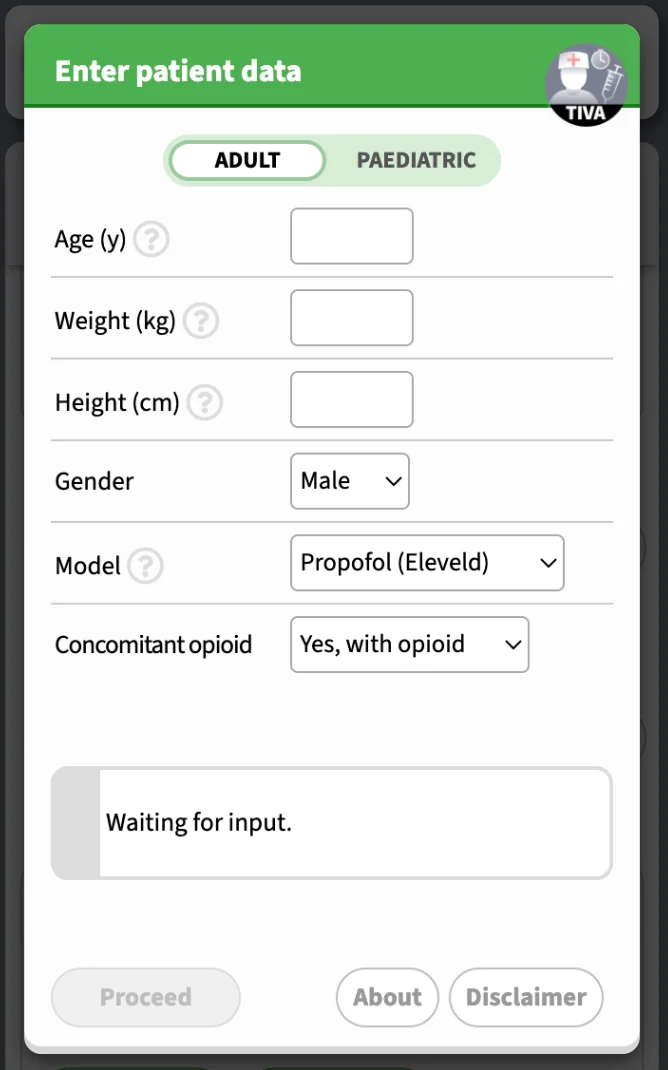
On the first screen, you may enter patient characteristics and choose a model. According to the model, there may be different patient parameters that are required. On the top, you can choose between "Adult" and "Paediatric" modes. For opioids, you will be required to enter the dilution.
Validation
Data validation is applied to data input. BMI, weight-for-age & length-for-age are displayed where available, according to WHO definitions and Child Growth Standards. Extreme body habitus will invoke a warning prompt.
Paediatric patient
In the paediatric mode, additional features are provided:
- Unit of age: y/m/d
- Post-menstrual age: coparameter in Eleveld model - prematurity affects clearance in <6months
- Validation of weight with WHO Child Growth Standards
- Custom opioid dilution
- Age-dependent estimated BIS for Eleveld model
Other features that exist on adult patients are also provided for the paediatric patient, e.g. complex mode and PD interaction of propofol-opioid.
In the following video demo, propofol and remifentanil CET regimens are simulated in children. Remifentanil dilution can be customized.
Paediatric #TIVA with https://t.co/qLpMHjFA1Q (1/3)https://t.co/KXov8b2dRM has TCI functions specially designed for children, but not as an afterthought. In this video, propofol and remifentanil CET regimens are simulated. Remifentanil dilution can be customized. pic.twitter.com/1jMePtz0kp
— SimTIVA (@simtiva_app) September 24, 2023
Drugs and models
The available models are:
- Propofol: Eleveld, Marsh, Schnider, Paedfusor
- Remifentanil: Minto, Eleveld
- Fentanyl: Shafer
- Alfentanil: Maitre
- Complex mode: to simulate the combination of propofol and opioids, select "Complex (Dual mode)" in "Model" on the first screen. This will allow you to enter data for propofol and opioid on the second screen.
Mode selection screen
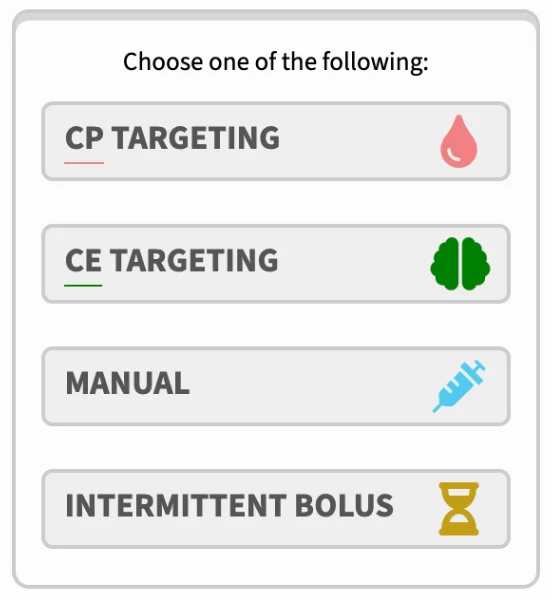
After selecting a model, you may choose one of four infusion modes, namely CP targeting, CE targeting, manual bolus & infusion, and intermittent bolus. These will be explained in detail in Chapter 2.
If you have selected "Complex (Dual mode)" in "Model" on first screen, you can customize your propofol and opioid information on the second screen. For example, the PK model and drug dilution can be entered.
Installation/Download
Simtiva.app is a website that can function as a web application. This means that you may run it inside your web browser (Safari on iPhone, Chrome on Android, or other browsers on desktop), or you may choose to install it directly through your browser. Once it is installed, it adds an icon to your homescreen that acts as the shortcut to the app and it can also be used offline - without internet access. Demos for installation on iPhone and Android illustrated below:
iPhone iOS Safari:
Did you know...?https://t.co/KXov8b2dRM is a progressive web app (PWA). It can function like any other webpage on your browser on mobiles & computers.
— SimTIVA (@simtiva_app) November 16, 2023
What's more, u can install it on your iPhone (see video/screenshot) by clicking share -> add to homescreen.#TIVA #TCI pic.twitter.com/t5zCk67GY5
Android Chrome:
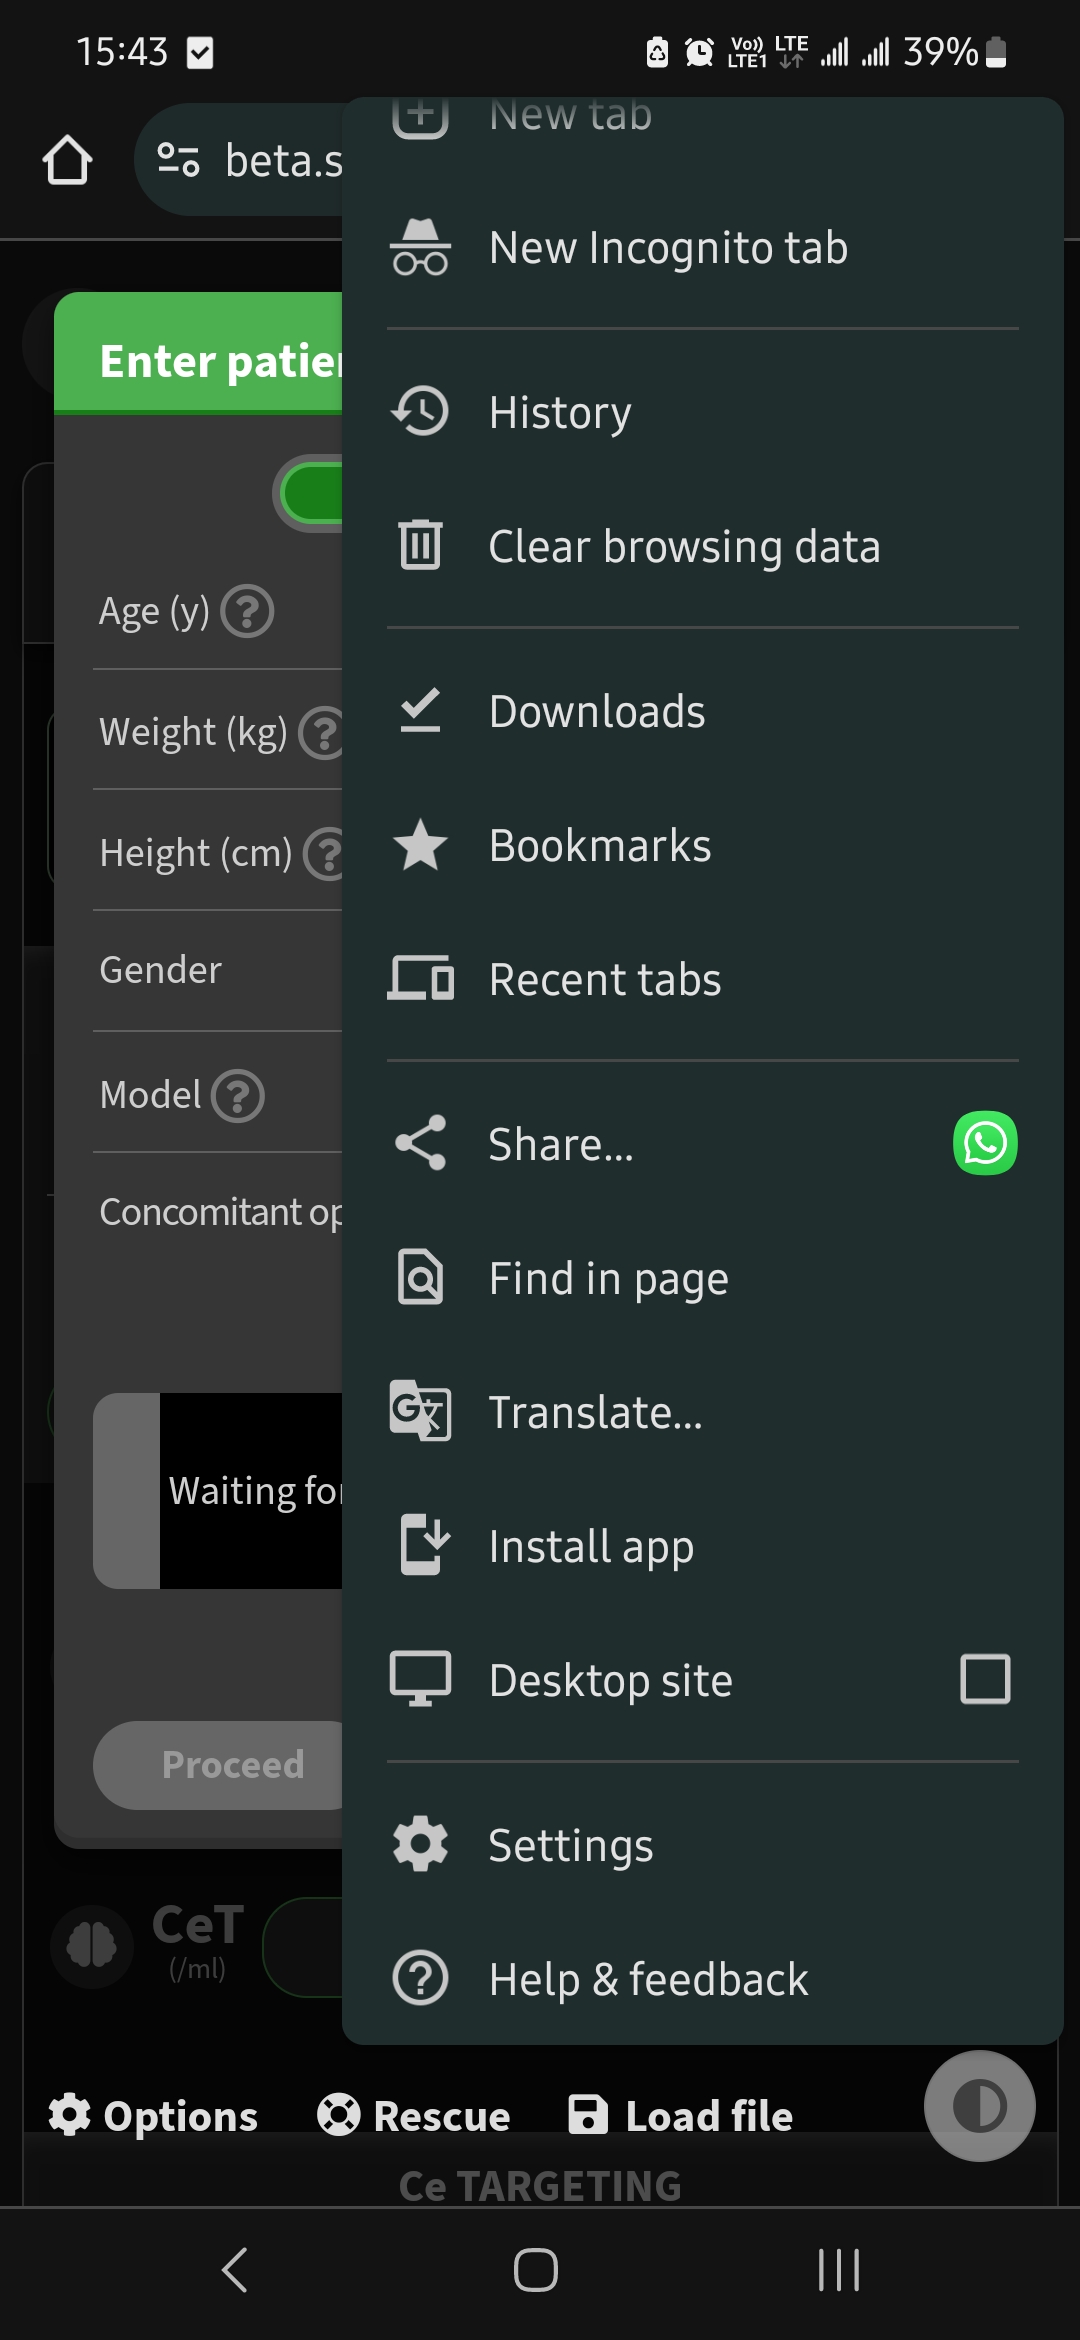
Select "Install App" from the menu button.
Simulation modes
There are 4 modes for single-drug simulation, namely CP targeting (plasma site targeting), CE targeting (effect site targeting), manual mode, or intermittent bolus mode. In addition there is a "Complex (Dual mode)" to simulate simultaneous infusions of propofol in combination with an opioid of your choice.
The pharmacokinetic calculations are based on STANPUMP, created by Steven Shafer, freely available from opentci.org. Full credits and details available on "About" screen.
Caution on accuracy
Please note that SimTIVA is a computer simulation program only to simulate the delivery of TIVA using a TCI pump; but it has no physical connection interface with a syringe pump. SimTIVA is designed in a way such that the user is assumed to have multiple busy tasks at hand and may not be free to adjust pump settings very frequently (say every 10 seconds). In a TCI pump, the infusion rates are updated frequently, e.g. every 10 seconds. However, in SimTIVA, the concept is to simplify the infusion regimen so that the infusion rates need to be adjusted just several times per hour (definitely not every other second or minute), otherwise it will be too cumbersome for the anaesthetist looking after the patient to frequently alter the infusion rate on the pump. With this in mind, in CPT or CET mode, SimTIVA infusion regimen only requires you to change infusion rates for typically 5-7 times for the first hour or so. The downside of this is accuracy, SimTIVA will not be able to deliver a perfect CP/CE target because the CP/CE will fluctuate if the infusion rates are not adjusted very frequently.
Realtime simulation
SimTIVA is designed to run in real time, i.e. parallel to the actual time sequence of a clinical case. The clock (displayed on the top left corner) will start ticking the moment you start your simulation. For advanced feature in resetting the timeline, or going back partially or going forward in time, read Chapter 7 - Working with timeline.
Overview of information display
In all modes, the current CP and CE are displayed on top. A third box will also appear, indicating the infusion rate in ml/h, if an infusion is running. The main pharmacokinetic graph visualizes the plot of CP/CE values over time. If you are using the Eleveld propofol model, a box will appear below the main pharmacokinetic graph, showing the predicted bispectral index (BIS) value, which is estimated from the Eleveld pharmacodynamic model.
For a more detailed walkthrough on using graphs in SimTIVA, proceed to Chapter 5: Working with Graphs.
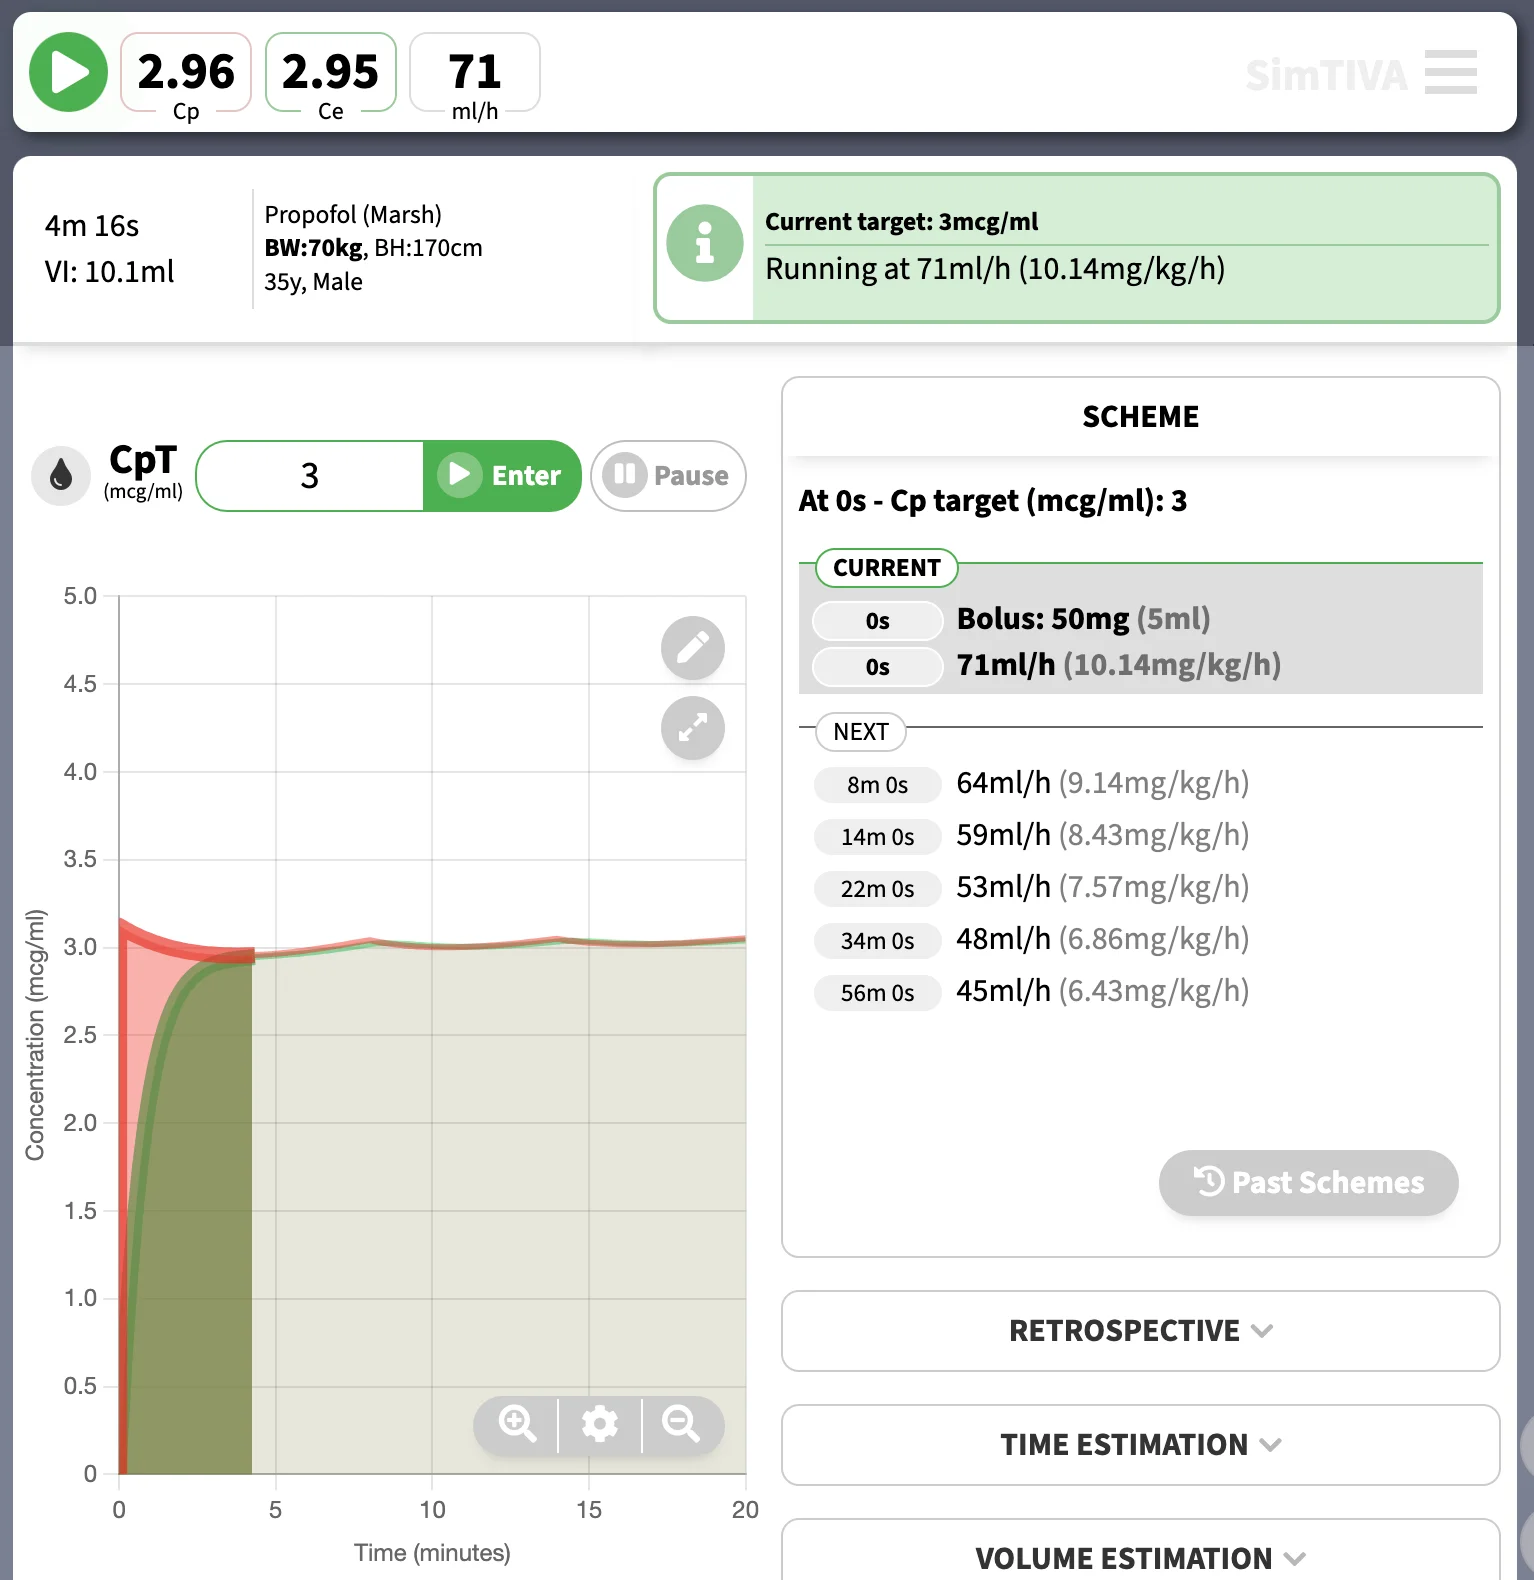
CP Targeting mode (plasma site)
In this mode, you can enter a CP target. For example, setting a propofol target CP of 3mcg/ml using the Marsh model will give rise to the following infusion regimen. The current CP, CE, and infusion rate will be displayed at the top of the screen. The suggested infusion CPT regimen is listed under "Scheme" to guide you through the next rate changes to maintain your desired target concentration. On mobile devices, you may need to swap between "Graph" and "Scheme" displays.
Preview box
As you enter your CP target, a blue box will appear, suggesting the action for you to follow. For example, a bolus followed by an infusion in ml/h.
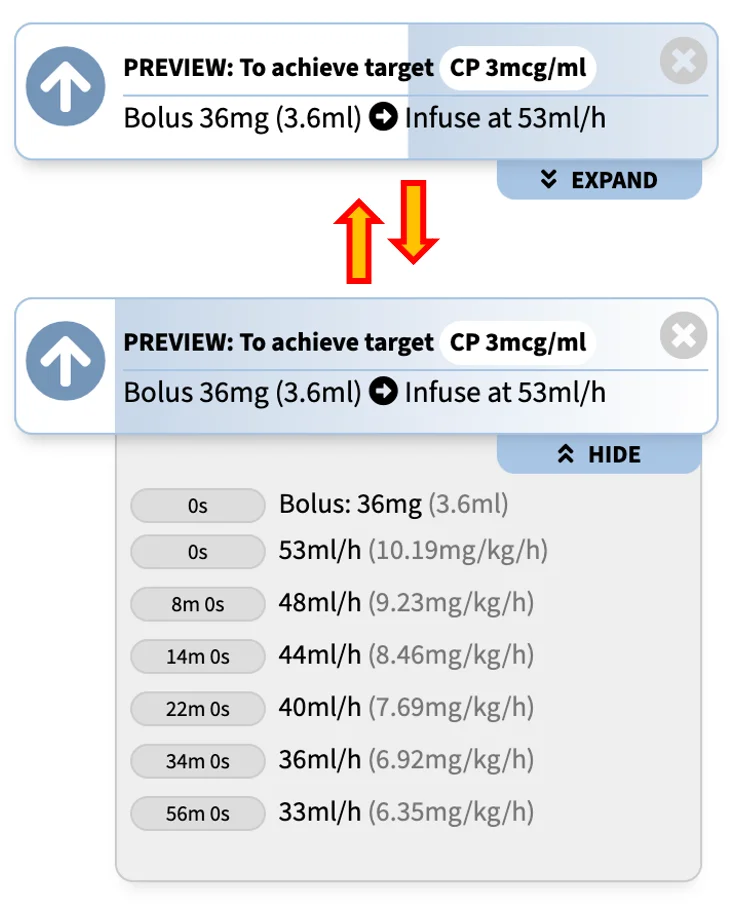
You can click "Expand" to expand the preview box to a full preview, that will present to you the entire TCI scheme for the next few hours. Clicking "Hide" will collapse the box to its original state.
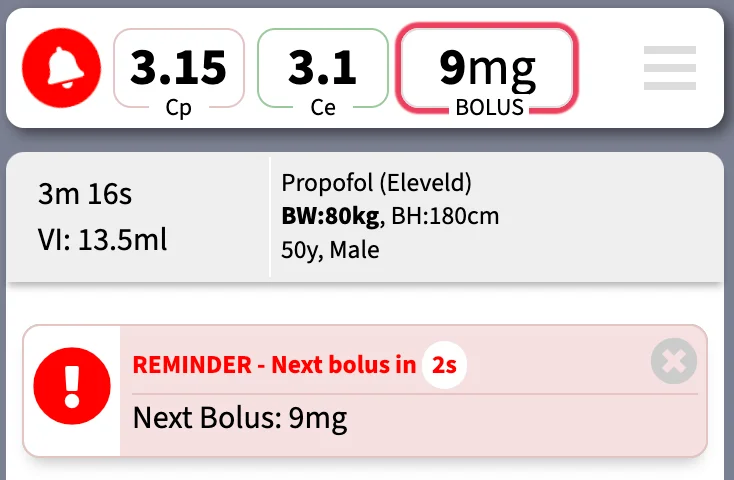
Reminder box
When the next infusion rate change is imminent, a red reminder box will remind you about it. If "Notification" and/or "Sound" in Options have been turned on, the prompts will appear at appropriate times (supported devices only). Please refer to Chpater 3 - Options. "Close" button will hide the reminder box prompt temporarily.

CE Targeting mode (effect site)
In this mode, you can enter a CE target. Typically, the plasma concentration is allowed to overshoot to accomodate the fast achievement of CE towards target. Also, there is a pause after the initial bolus for CE to equilibrate with CP. For example, setting a propofol target CP of 3mcg/ml using the Eleveld model will give rise to the following infusion regimen. The current CP, CE, and infusion rate will be displayed at the top of the screen. The suggested infusion CET regimen is listed under "Scheme" to guide you through the next rate changes to maintain your desired target concentration. On mobile devices, you may need to swap between "Graph" and "Scheme" displays.
Expanding the preview box
As mentioned above, a preview box will appear as you enter a CE target. A practical tip is that you may expand the preview box by clicking "Expand" below the blue preview box to have a full understanding of the entire CET scheme before starting your infusion. Demo as below:
https://t.co/4zrK2ZezXO first update in 2024. User interface of CET and CPT modes has been re-designed. More importantly, a full preview of scheme is available (click “expand”) so you can preview the new scheme before submitting it. Other bugfixes in changelog. pic.twitter.com/05hZqyiVJD
— SimTIVA (@simtiva_app) January 20, 2024
Manual mode
In this mode, you can enter the bolus and infusion rate manually. The bolus input unit can be entered as ml, mg, or mg/kg for propofol, or ml, mcg, or mcg/kg for opioids. The infusion unit, similarly, can be configured on a volume, mass/time, or mass/body weight/time basis. You can change these units by clicking on the arrow next to the bolus/infusion input. The current CP, CE, and infusion rate will be displayed at the top of the screen.
Wrapping up 2023 with a New feature (https://t.co/4zrK2ZezXO): Bolus & Infusion units- U may now switch between “mg” vs “mg/kg” vs “ml” for bolus, “ml/h” vs “mg/kg/h” (or appropriate units) for infusion in manual mode.
— SimTIVA (@simtiva_app) December 17, 2023
Can switch by tapping the dropdown 🔽 or via “Options”.
(1/2) pic.twitter.com/hCthkRDMbO
Intermittent bolus mode
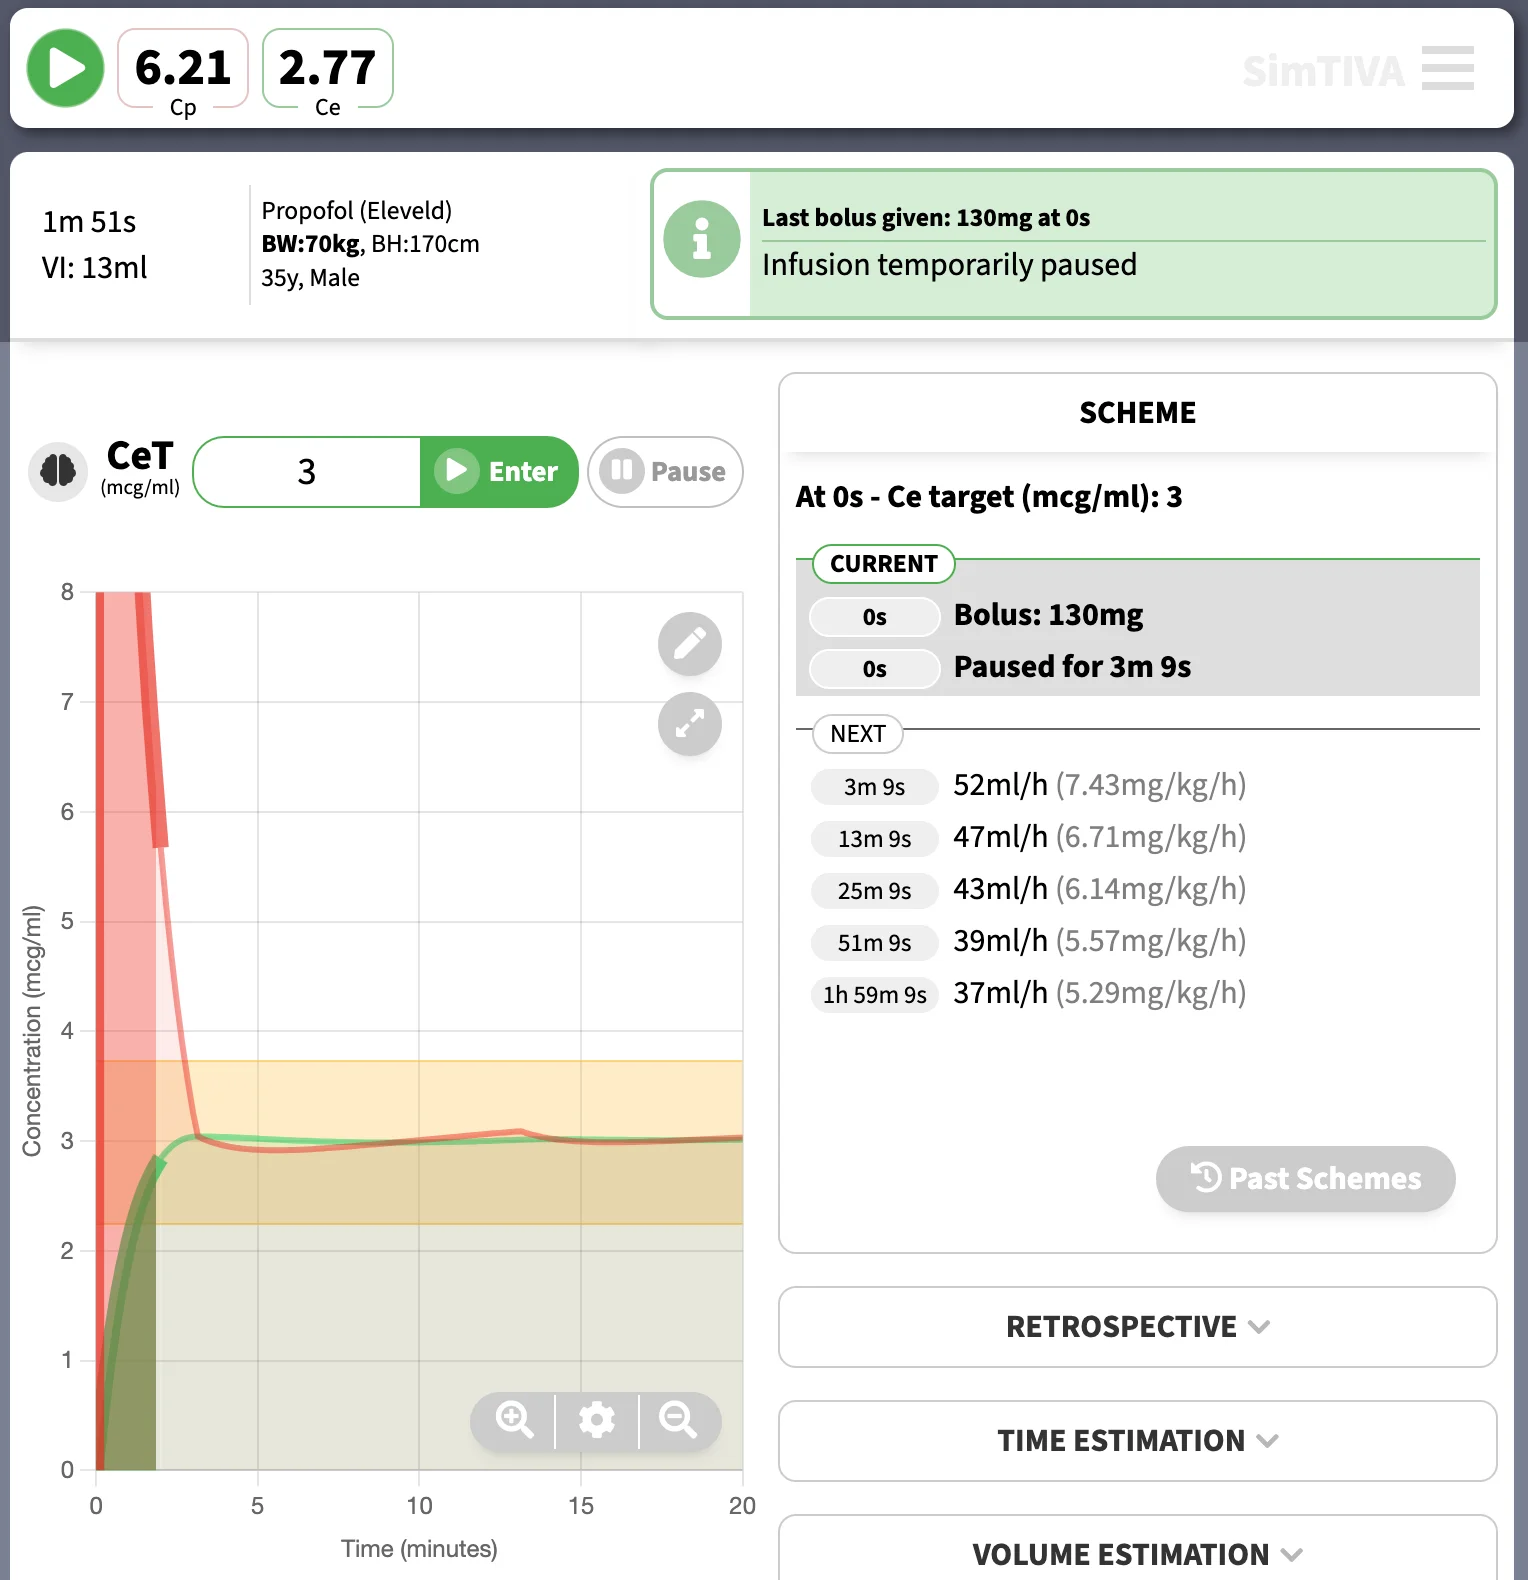
In this mode, a scheme of intermittent repeated boluses is generated to achieve and maintain a certain target effect site concentration. This is suitable in a setting, where there is no syringe pumps available, for example a short case in a remote location or in a low-resource environment. With the intermittent bolus mode, a series of repeated small manual boluses are generated, to simulate a target-controlled infusion as close as possible. The accuracy of the repeated intermittent bolus scheme is affecetd by the fluctuation of CE. Caution: this mode does not take into the account of adverse effects of administering boluses, especially in larger doses, for example, a drug such as remifentanil may not be suitable to be given in intermittent boluses due to side effects of bradycardia and apnoea.
The bolus amount and time interval will vary according to the CE target as well as the anticipated level of fluctuation of CE - described as peak/trough levels in this app. The peak/trough levels represent the magnitude of fluctuation for Ce. For example, when set to ±5%, the Ce will reach a maximum of 105% of target and then drop to a minimum of 95% of target. At the trough level, another bolus will be administered, and the cycle repeats.
Please see the example below, in a simulated patient, to achieve approximate CE target of 3mcg/ml using the Eleveld model for propofol:
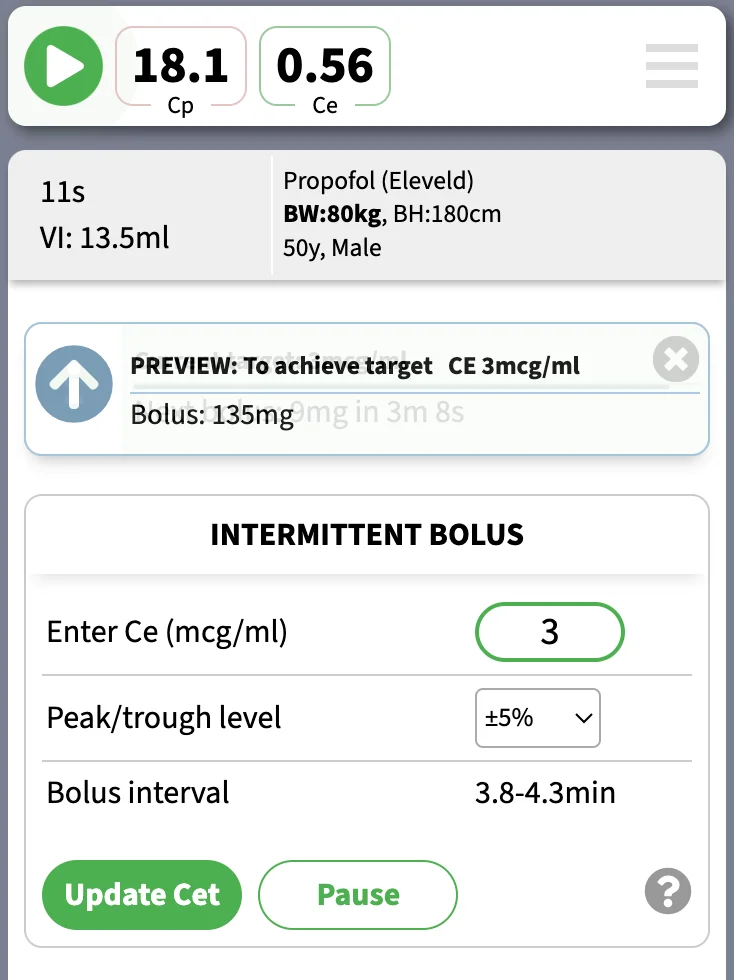
The information box will display a horizontal countdown bar as well as a timer to notify you of the next bolus amount.

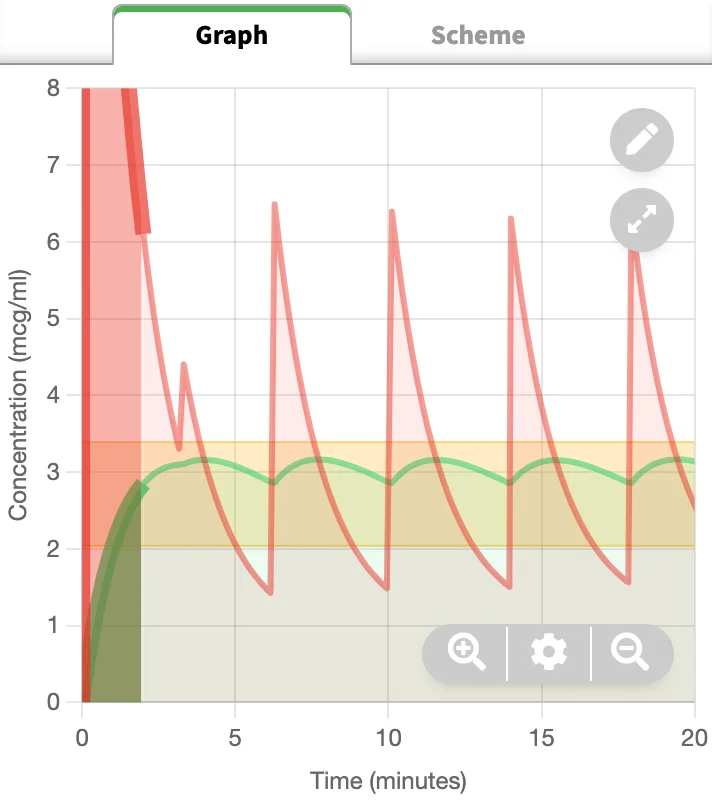
The generated scheme will result in a pharmacokinetic graph like the following. Note the fluctuation in CE in response to repeated boluses; within the preset margins of ±5% in this example. The CP values will fluctuate widely.
The scheme to achieve and maintain CE target of 3mcg/ml is given below.
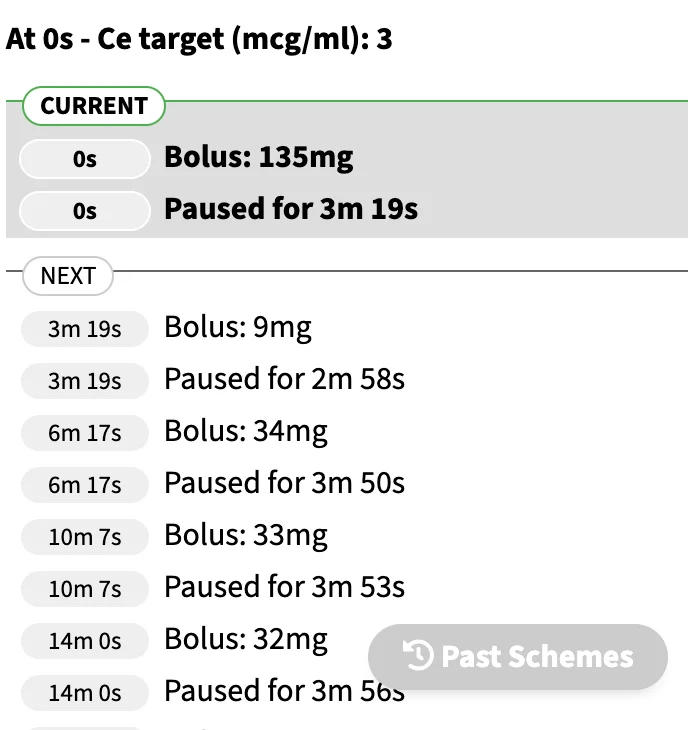
When the next bolus is about to be delivered, a warning prompt will appear to remind you of an upcoming bolus. The bolus amount will also flash on the top display box.
Complex (Dual) mode
In this mode, you may run two-drug simulations simultaneously. For each drug, the functions for CP or CE targeting, manual infusion, or intermittent bolus mode are preserved. In addition, you may explore the pharmacodynamic (PD) interaction between propofol and opioid, as propofol and opioid demonstrate intense synergism. Probability of tolerance to laryngoscopy (PTOL) is used as a measure of potency of propofol-opioid combination. Isobologram charts illustrate the propofol-opioid combinations to achieve the same pharmacodynamic effect.
For details, please read Chapter 8: Complex mode
Isobologram: Using different combinations of CE-propofol and CE-remifentanil (effect-site concentrations of propofol and remifentanil respectively), all yielding the same predicted response (90% probability to tolerate laryngoscopy, PTOL90), a line (isobole) is drawn connecting all the possible combinations of CE-propofol/CE-remifentanil to achieve the same identical effect (van den Berg 2021). In our simulation programme, the same method is repeated for PTOL80, PTOL70... PTOL10 to generate a total of 9 isoboles on the 2-dimensional chart. The contour of the isoboles is typical of synergism, or supradditive interaction.
For the opioid, you may choose to use remifentanil, fentanyl, or alfentanil. The program converts the CE into equivalent doses.
Below is a video demostration of complex mode, with manual infusions of propofol and remifentanil.
(4/5)
— SimTIVA (@simtiva_app) September 16, 2023
When is anaesthedia "too deep" or "too light"? https://t.co/KXov8b2dRM enables PD modelling & displays a "green zone" to mark the CE margins required to achieve PTOL50-90. In this example, CE is in the green zone but is predicted to fall below PTOL50 margin beyond 7.5min pic.twitter.com/KJ0ICsQdeT
Advanced Features
This chapter will cover the following advanced features:
- Retrospective: Entering bolus or infusion data retrospectively
- Volume estimation: Compute the volume required for a given duration
- Time estimation: Compute how long the infusion is going to last given a volume-to-be-infused
- Wakeup time: Decrement time to a certain wakeup concentration
- Eleveld emulation: For Marsh or Schnider models for propofol, SimTIVA can emulate Eleveld model using the infusion profile from a Marsh or Schnider infusion regimen.
Advanced Features
Retrospective
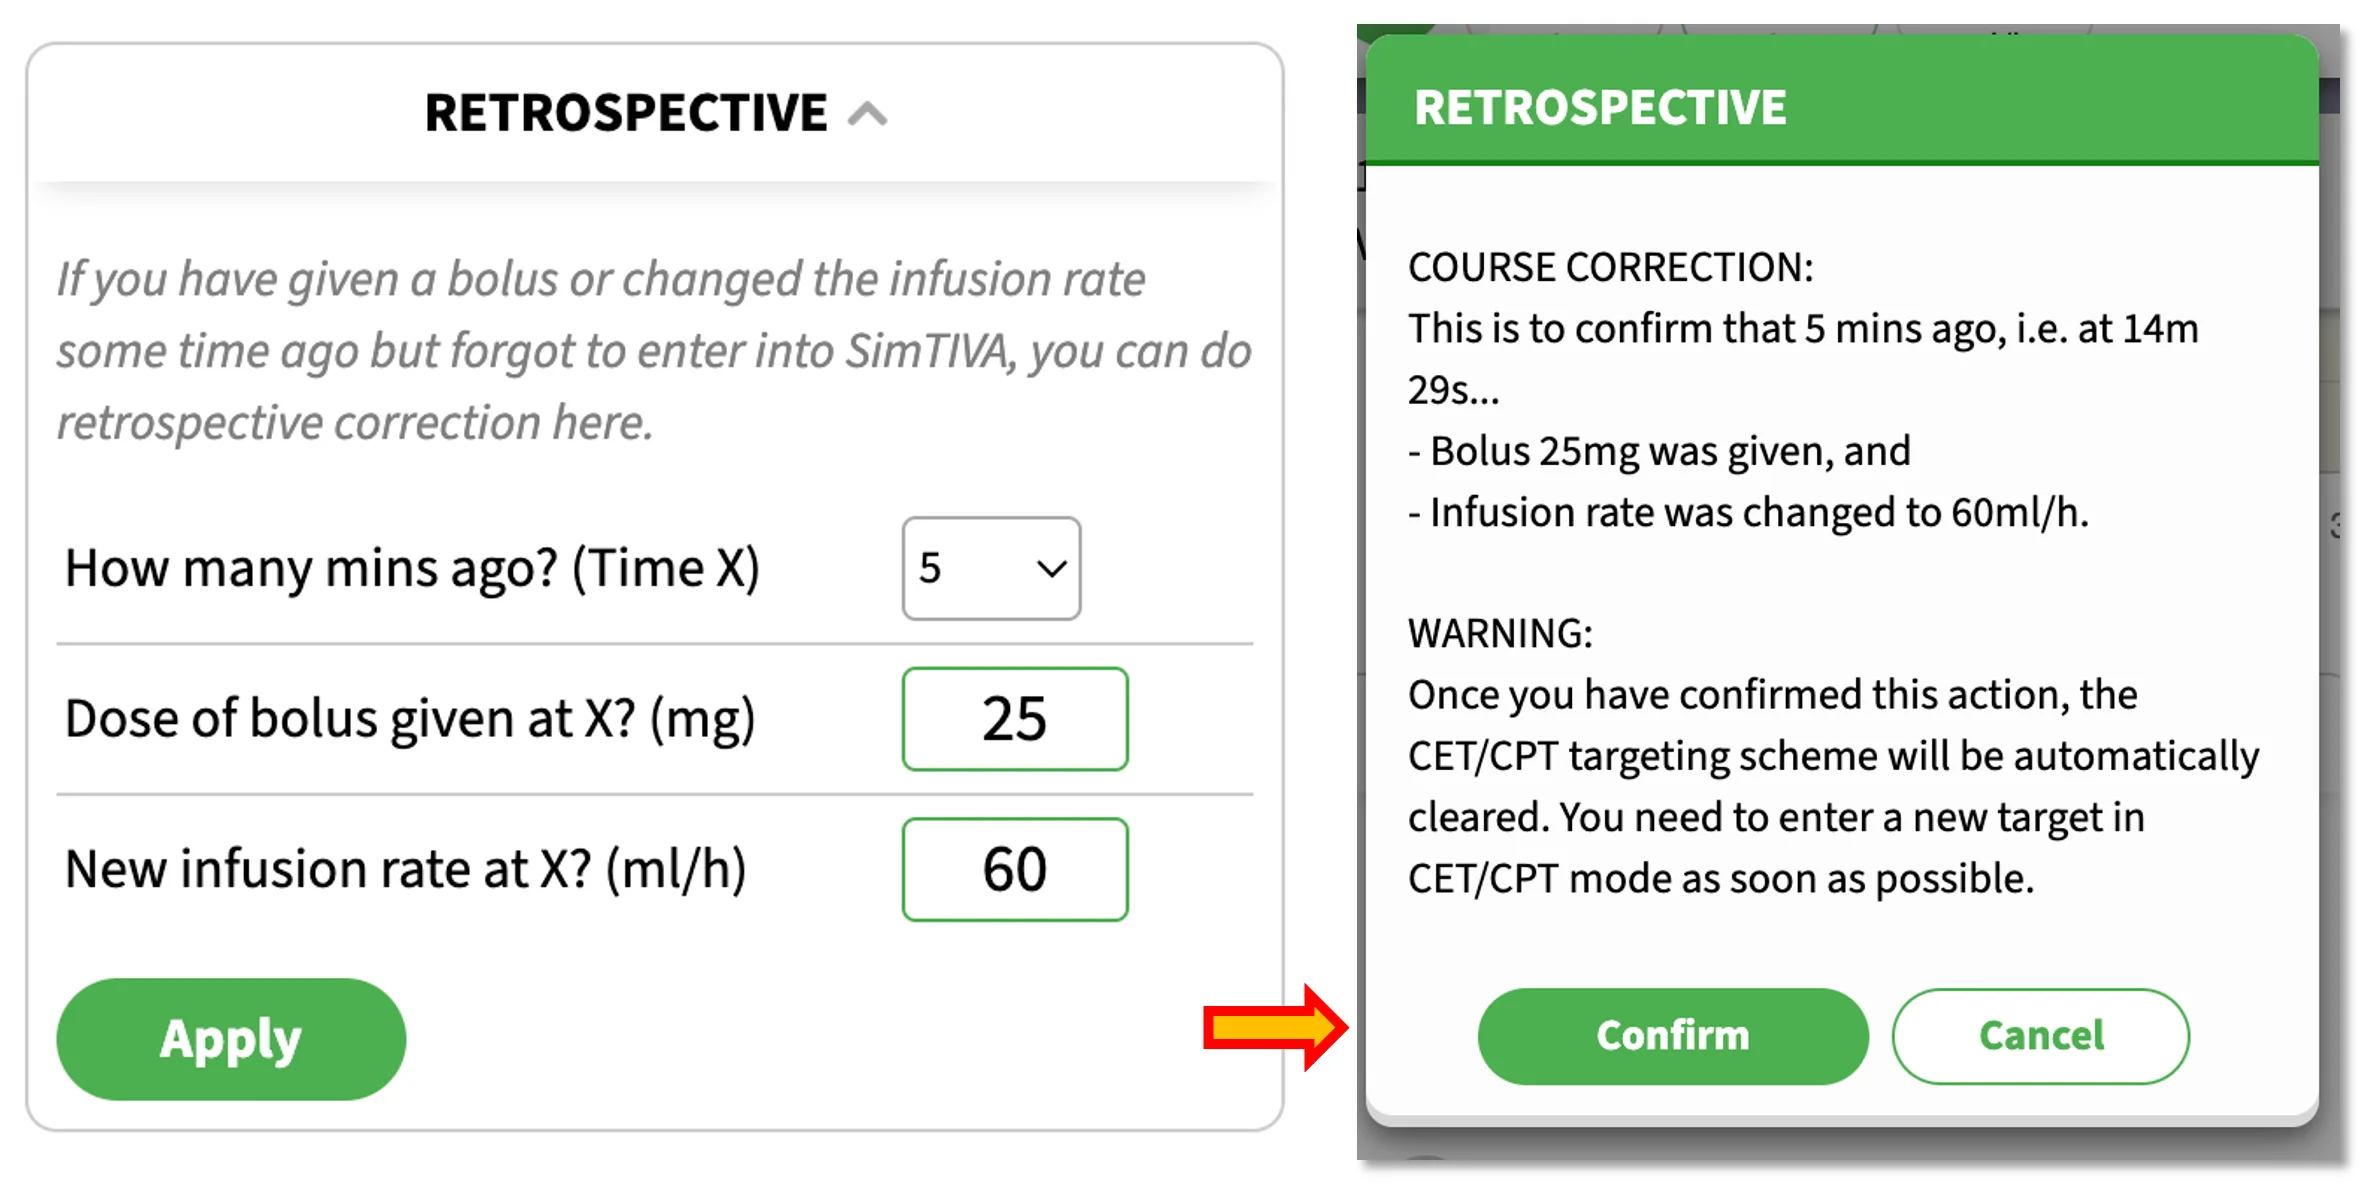
This feature allows you to retrospectively edit a manual bolus and infusion rate change. For example, the patient had surgical stimulation a few minutes ago, and you have given a manual bolus (25mg propofol) and adjusted the infusion rate to 60ml/h but you have forgotten to enter these information in SimTIVA, you can correct this in SimTIVA by using the Retrospective Function. Enter the information as in the picture below. A warning prompt will appear asking you to confirm the data. After this action, you are reminded to enter a new CP or CE target as soon as possible to continue with TCI functionality.
Volume Estimation
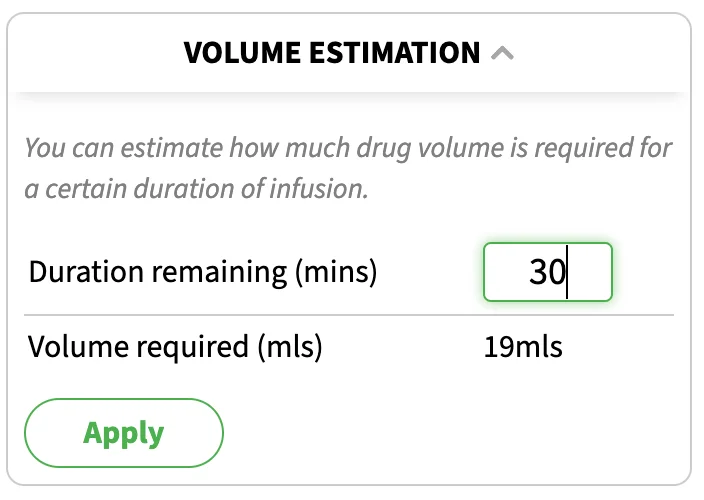
SimTIVA is running and you estimate the remaining surgery will take 30 minutes. How much propofol do you still need? The "Volume Estimation" panel will provide an answer, so that you will know if there is enough propofol in the syringe you are infusing, or how much more is required to be drawn up to avoid wastage.
Time Estimation
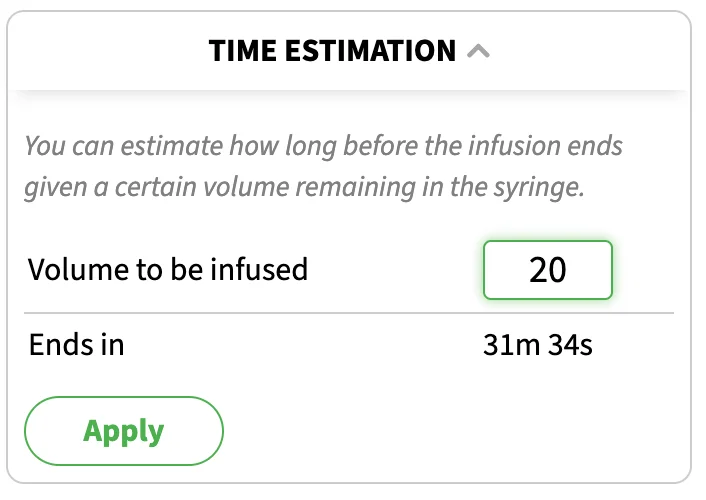
SimTIVA is running and you have a certain amount of propofol in the syringe that is currently being infused (e.g. 20mls remaining). Given the volume to be infused, what is the expected duration before this infusion is finished? The "Time Estimation" panel will provide an answer.
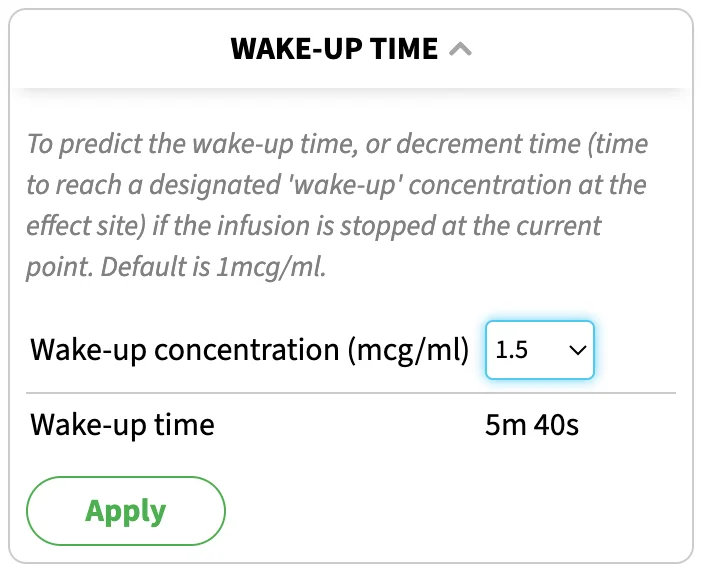
Wakeup Time
This panel is based on decrement time from the current CE to drop to the designated "wakeup concentration" if the infusion is stopped at the current time point. Please note the patient characteristics, concurrent medications, duration of infusion etc all have an effect on wake-up time.
Eleveld Emulation
Purpose
The purpose of this tool is to emulate Eleveld model by using an infusion profile generated from Marsh and Schnider TCI models. This way, you may use an existing TCI syringe pump programmed with these existing models and convert it into CP, CE, and estimated BIS in real time. You may also compare the older models (Marsh/Schnider) with the newer generation Eleveld model through the simulation graph.
The advantages of using Eleveld model include:
(1) Allometric scaling: by using fat-free mass, the model automatically corrects for obesity. This avoids dosing errors such as using actual body weight in Schnider model, which can lead to erroneously high infusion rates because of usage of James formula for calculating lean body mass in Schnider model.
(2) Prediction of BIS: from its large dataset of over 1,000 patients with BIS measurements, a calibration curve is provided, to convert CE to an estimated BIS. In a validation study, the estimated BIS was found to be accurate.
In view of the above, the Eleveld emulation tool can help anaesthetists to understand the Eleveld model better by deriving infusion data from a model they are more familiar with (Marsh or Schnider) and convert it into CP, CE, and estimated BIS values calculated from the Eleveld model. Using the graph provided, by moving the cursor over the time axis, you can learn about the differences between the models.
Prerequisites: you must provide age, body weight and body height, and choose either Marsh or Schnider models on the input screen. Complex mode is not supported at this time.
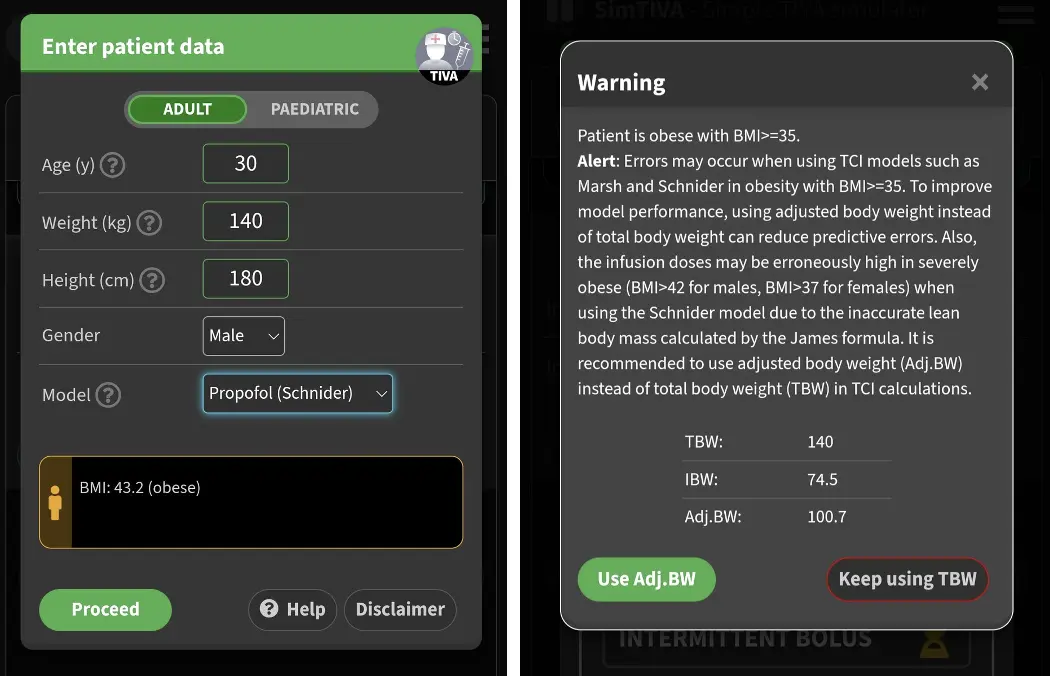
Note about obesity: you should enter the actual body weight on the first screen. If severe obesity is detected (BMI>=35), you may be prompted to use adjusted body weight (Adj.BW) instead of total body weight (TBW) to improve model performance of Marsh/Schnider (Cortinez 2014). You can choose to use Adj.BW as suggested. The Eleveld emulation will then be based on TBW because Eleveld model does not require body weight adjustment, but the Marsh/Schnider model will be based on Adj.BW. So, in this scenario, you will be comparing between a Marsh/Schnider-Adj.BW model with an Eleveld-TBW model.
Demonstration 1 - Normal body weight, Marsh
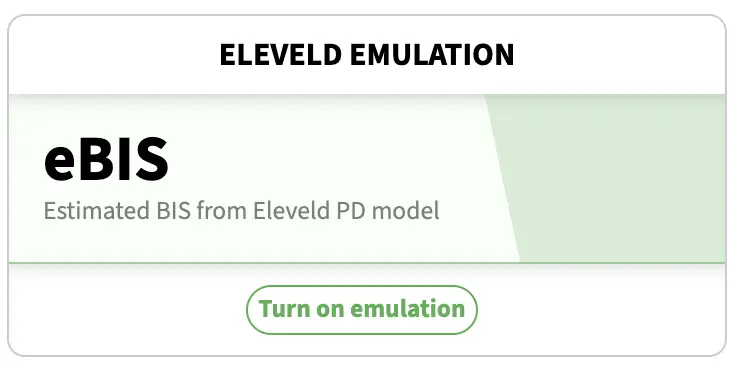
Suppose we enter these patient characteristics: Marsh-CP targeting for a 50-year-old, 70kg, 170cm man. In the bottom of the main graph, there is the Eleveld emulation module. Click "Turn On Emulation" to begin.
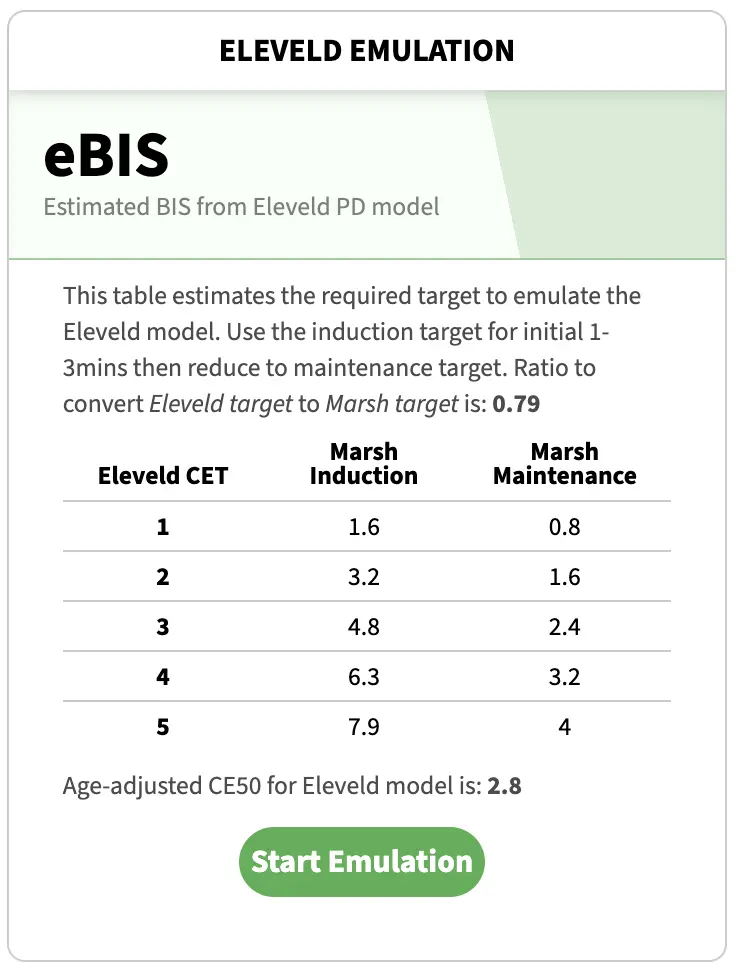
A table will be provided to help convert a Marsh-CP target to an Eleveld-CE target. A ratio for conversion will be provided. This ratio is to guide the delivery of an Eleveld CE target at steady state. The table provides "Induction" and "Maintenence" targets, where "Induction" target should be used for the initial 1-3minutes while the Marsh CP target should be dropped to "Maintenence" target afterwards. The emulation graph will show you more details of how the Eleveld CP, CE change over time. Click "Start Emulation" to proceed with the emulation tool. You may refer to this emulation target reference table at a later time, by clicking the "Details" button on the emulation graph.
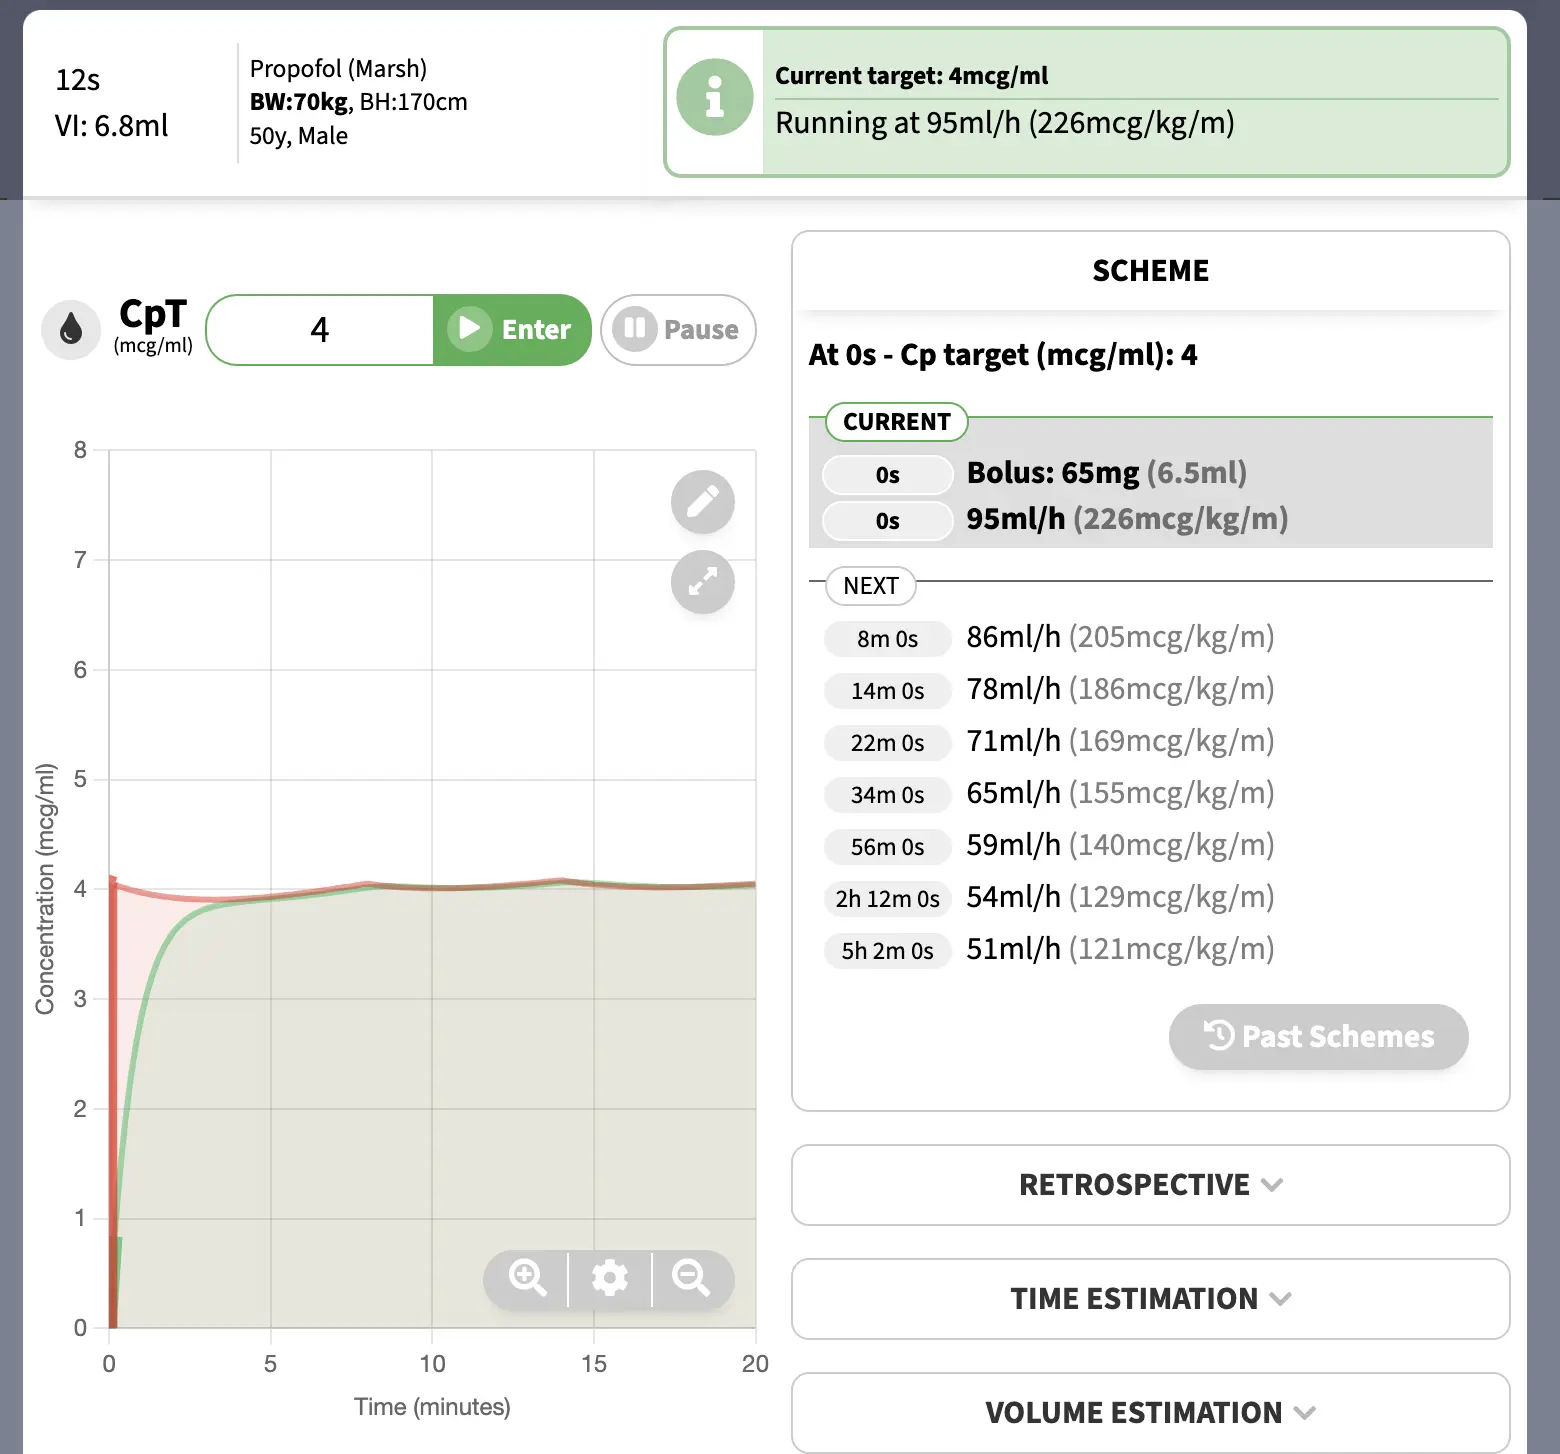
By setting a CPT of 4, the infusion regimen generated by a Marsh-CPT program is as follows. The emulation module will feed in this infusion profile into an Eleveld model and generate Eleveld CP, CE, and estimated BIS.
BIS prediction: the estimated BIS will be shown on top of the emulation module. In this example, the initial CPT was set at 4mcg/ml, then reduced to 2.5mcg/ml at approximately 5mins. On the graph, by moving the cursor, you can also preview the estimated BIS at different times.
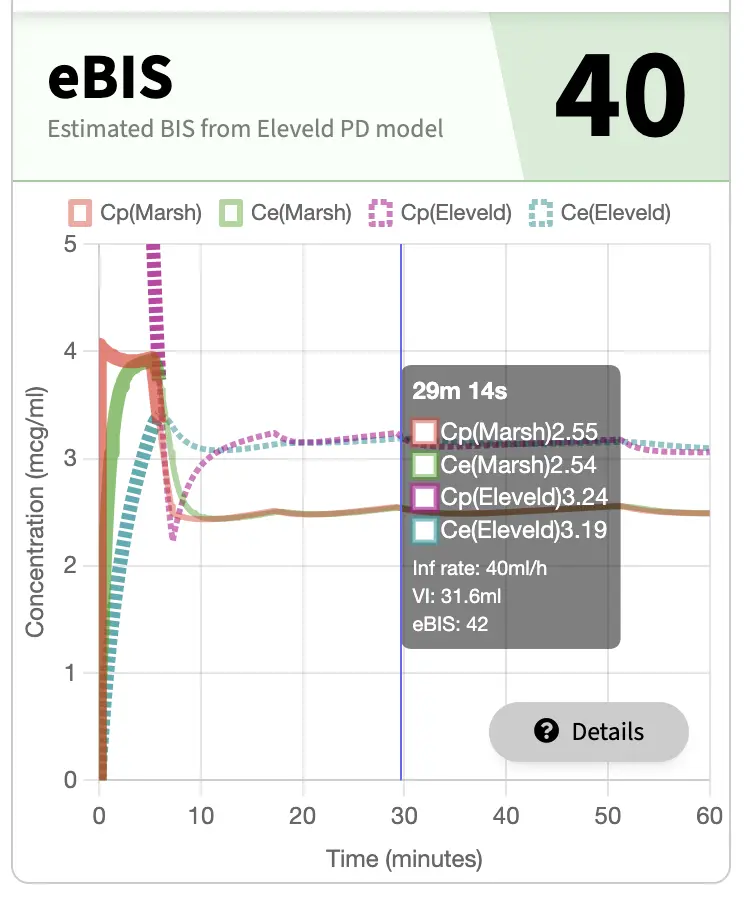
From the above graph, you can see that at around 30minutes, the Elevled predicted a CE level of 3.19mcg/ml, whereas Marsh model predicted a CE level of 2.54mcg/ml.
Demonstration 2 - Obese patient, Marsh
Like the example above, we used Simtiva emulation module to emulate Eleveld model from Marsh model. This time, the patient was an obese individual with BMI 41 (BW: 120kg, BH: 170cm). Please note that you should always enter the actual body weight into Simtiva app, the app will perform body weight adjustment for you. The app will prompt you to use "Adjusted body weight" to improve the performance of the model (when using Marsh). See "Allometric Scaling" and "Note on obesity" above for more background details.
Please watch the video below.
Using adjusted BW can improve performance of Marsh model in severely obese. Using Eleveld emulation in https://t.co/4zrK2ZezXO, you can visualize the emulated Eleveld Cp/Ce when running an adj-BW Marsh infusion regimen. pic.twitter.com/qVdwTCq0yb
— SimTIVA (@simtiva_app) June 14, 2024
In this example, "Adjusted body weight" was used. The app will use adjusted body weight for calculation of Marsh model, and total body weight for calculation of Eleveld model.
A CP target of 6.1mcg/ml was chosen for induction. This approximates an Eleveld CE target of 3mcg/ml. Follow the infusion regimen suggested, and then later reduce the CP target to the maintenance target.
Example 3 - Obese patient using Schnider as an example
It is challenging to use the older TCI models in severely obese. As mentioned above, because of incorporation of James formula in calculating lean body mass in Schnider model, the infusion rate will be erroneously high because of a spuriously high clearance calculated. Hence, it is safer to use Adjusted body weight in the Schnider model. After entering the actual body weight into Simtiva, severe obesity is detected, and adjusted body weight is recommended.
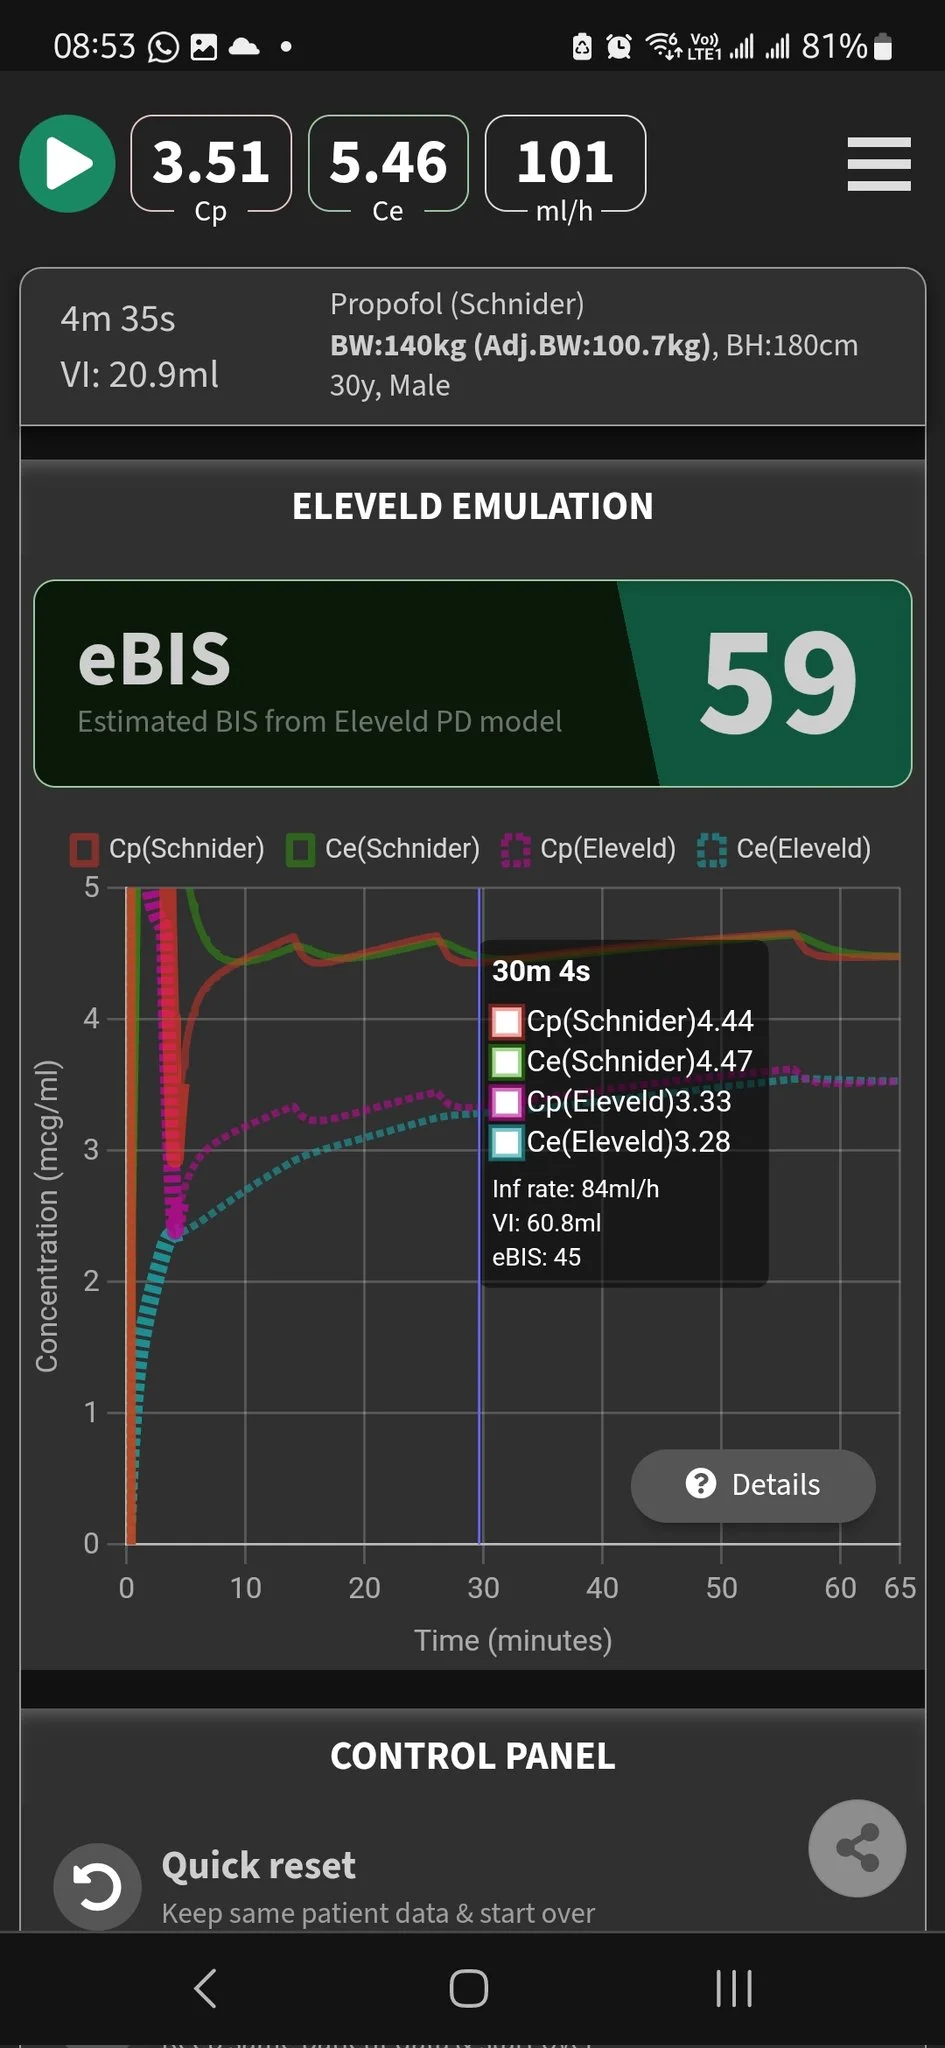
Combining body weight adjustment feature with Eleveld emulation feature, we can compare the performance of using Adj.BW-Schnider with TBW-Eleveld in real time, as illustrated below. Schnider CE target was set at 4.5mcg/ml in this example. Corresponding Eleveld parameters such as Eleveld CE and eBIS will be displayed accordingly.
Reference: Performance of propofol target-controlled infusion models in the obese: pharmacokinetic and pharmacodynamic analysis, Anesth Analg, Cortinez 2014.https://pubmed.ncbi.nlm.nih.gov/24977639/
OPTIONS
SimTIVA settings can be accessed on the welcome screen by clicking the options button. Alternatively, you may change the options when simulation is running, by going to the options panel at the bottom of the page.
Dark mode
You can switch between Dark / Light modes by clicking on the floating icon / at the right lower corner.
Saving options
All options are automatically saved, so that the next time you use SimTIVA the same settings are restored.
List of options
The options panel:
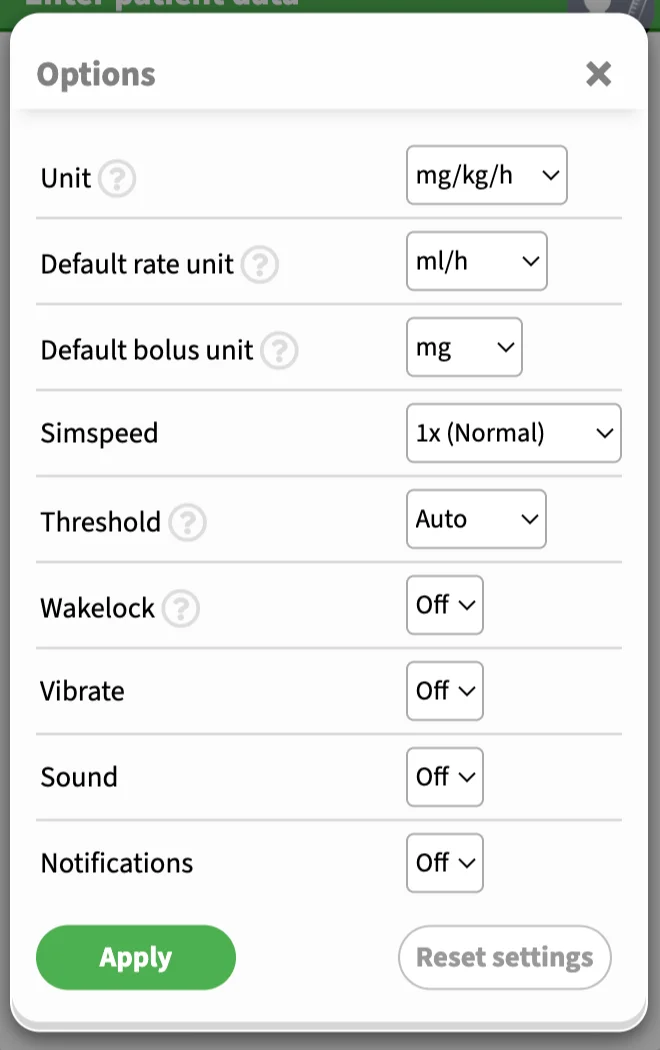
Unit: the preferred secondary unit for propofol infusion. The primary unit is always ml/h. The secondary unit is used in prompts, reminders and schemes. An example is 50ml/h (10mg/kg/h). The US convention for propofol infusion is mcg/kg/m and you can change this unit here.
Default rate unit: this is the default rate unit for infusion in manual mode. You can switch between "ml/h" or "mg/kg/h", or appropriate units. This will not affect other modes, such as the CP/CE targeting mode. A video demo is shown below.
Default bolus unit: this is the default bolus unit for manual bolus in manual mode. You can switch between "ml", "mg", or "mg/kg" (or appropriate units).
Simspeed: the default is 1x (normal speed), and you can change it to 5x, 25x, or 50x, which will speed up the simulation.
Threshold: there are three options for the threshold/accuracy option: "Auto", "Lazy", or "Accurate". For CP/CE targeting, SimTIVA generates an infusion scheme to maintain the CP (or CE) approximately equal to the target. "Auto" threshold means that the program automatically determines the optimal balance between accuracy in maintaining the CP (or CE) while keeping the number of rate changes of the infusion scheme as infrequent as possible. "Lazy" means that the program will sacrifice accuracy of maintaining the target by keeping the number of infusion rate changes over time to a minimum. "Accurate" threshold setting will keep CP (or CE) value as close to target as possible, but this may increase the number of times you adjust the infusion rate in a CP/CE targeting scheme.
Wakelock: on a supported device, such as an Android device, setting Wakelock to "On" will keep the screen awake. If you are using iPhone, you may have to adjust the screen timeout in system preferences yourself.
Vibrate: when the next rate change is imminent in CP/CE targeting mode, SimTIVA will activate vibration as a reminder (supported devices only).
Sound: when the next rate change is imminent in CP/CE targeting mode, SimTIVA will sound an audio alarm (supported devices only).
Notifications: when the next rate change is imminent in CP/CE targeting mode, SimTIVA will activate system notification (supported devices only).
Infusion unit in manual mode
This is a video demo of altering the infusion and bolus units. You can also click the dropdown triangle next to the "Infusion rate" or "Bolus" entry fields to change these units. The conversion between ml/h and mg/kg/h is automatic.
Wrapping up 2023 with a New feature (https://t.co/4zrK2ZezXO): Bolus & Infusion units- U may now switch between “mg” vs “mg/kg” vs “ml” for bolus, “ml/h” vs “mg/kg/h” (or appropriate units) for infusion in manual mode.
— SimTIVA (@simtiva_app) December 17, 2023
Can switch by tapping the dropdown 🔽 or via “Options”.
(1/2) pic.twitter.com/hCthkRDMbO
Working with graphs
Overview
On mobile devices, the main graph looks like this:
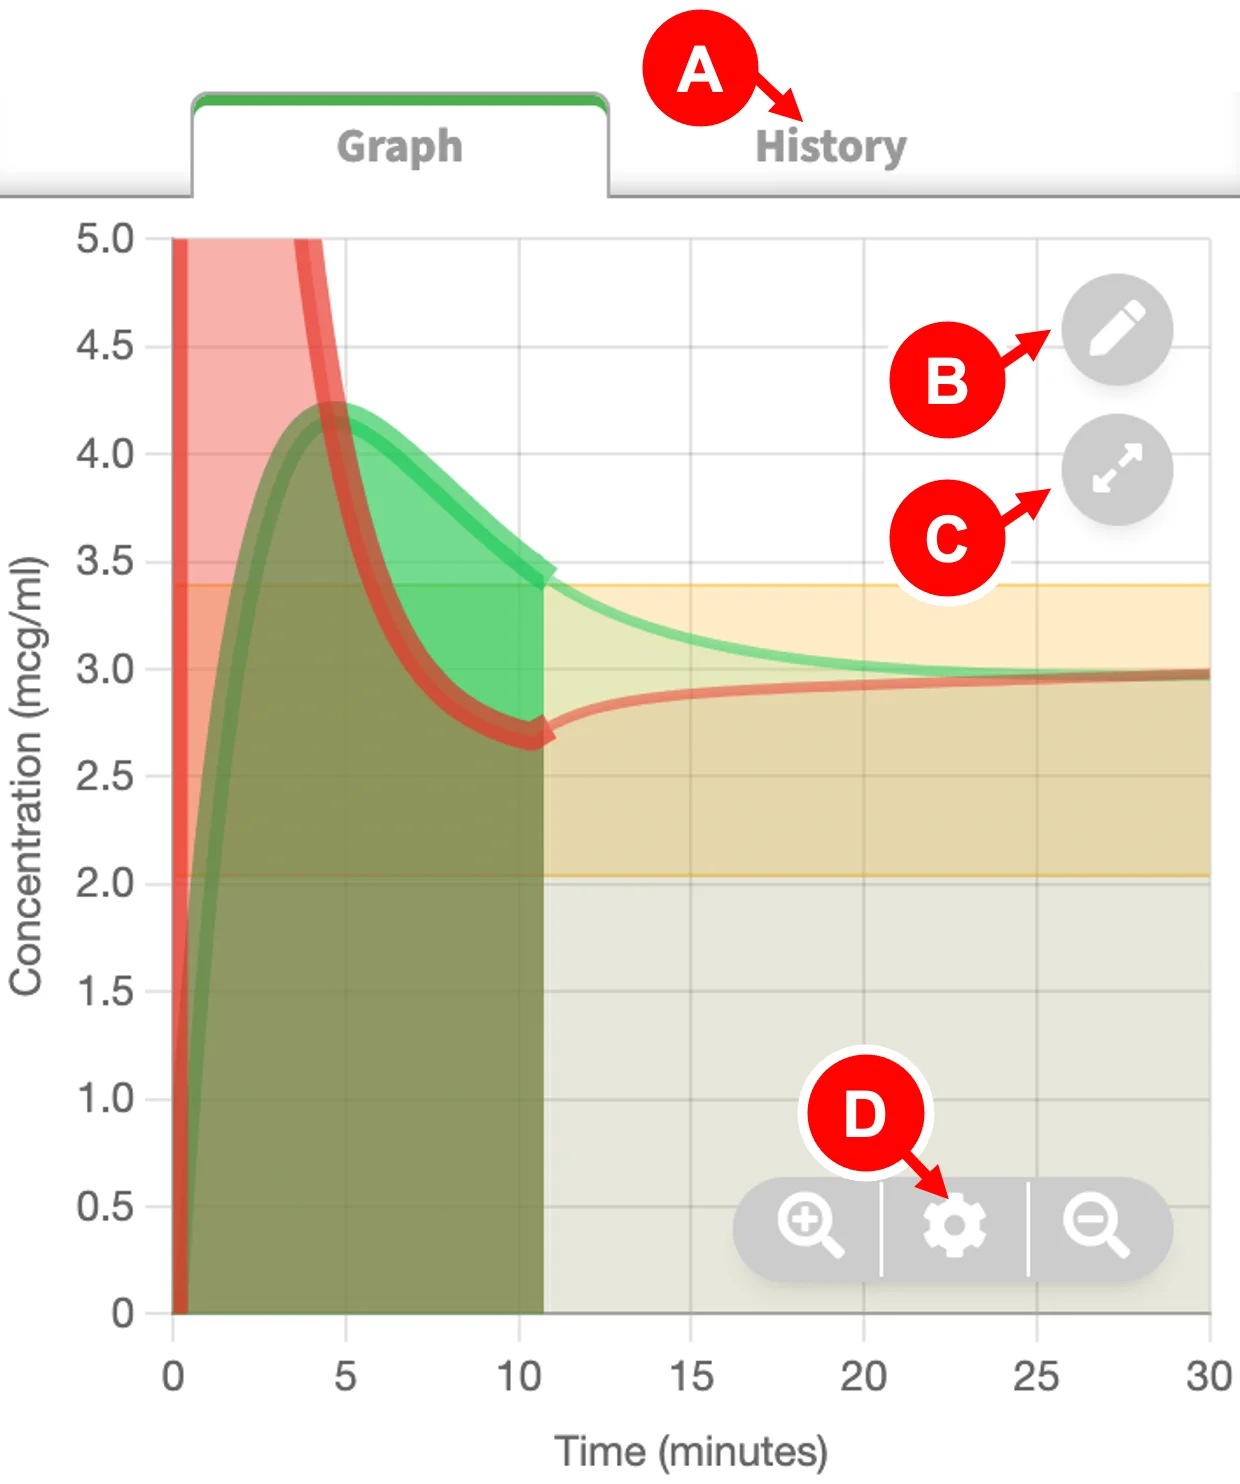
- History/Scheme button: shows "History" in manual mode and "Scheme" in CPT/CET mode
- Event button: Annotate event at current time. You can edit the time and event details later on. Events are numbered and displayed at bottom of graph.
- Fullscreen button: maximizes the graph and hides controls.
- Graph options button: Opens the options panel - you can adjust the time scale among other options. The and buttons will change the time scale to show the entire timeline or just the current portion.
Video demo of quick view info box
In this video demonstration, you can see that an info box appears in the main graph as move your cursor. (On mobile devices this means tapping on graph area, on desktop computers this means hovering over the graph area with mouse.) By highlighting a certain timepoint, the info box will display important data such as CP, CE, infusion rate, and estimated BIS (available in Eleveld propofol model only). This video also shows how you can adjust the time scale to show more (or less) of the timeline.
#tiva #tci #anaesthesia
— SimTIVA (@simtiva_app) September 11, 2023
Showcasing the updated feature of https://t.co/qLpMHjFA1Q - using Eleveld model, an estimated BIS value is displayed. The chart also shows the CE boundaries for BIS 40-60. This allows estimation of effect without pEEG.
Chart duration also extends to 2h. pic.twitter.com/i6O9ITw7vv
Graph options panel
To open this panel, click the icon.
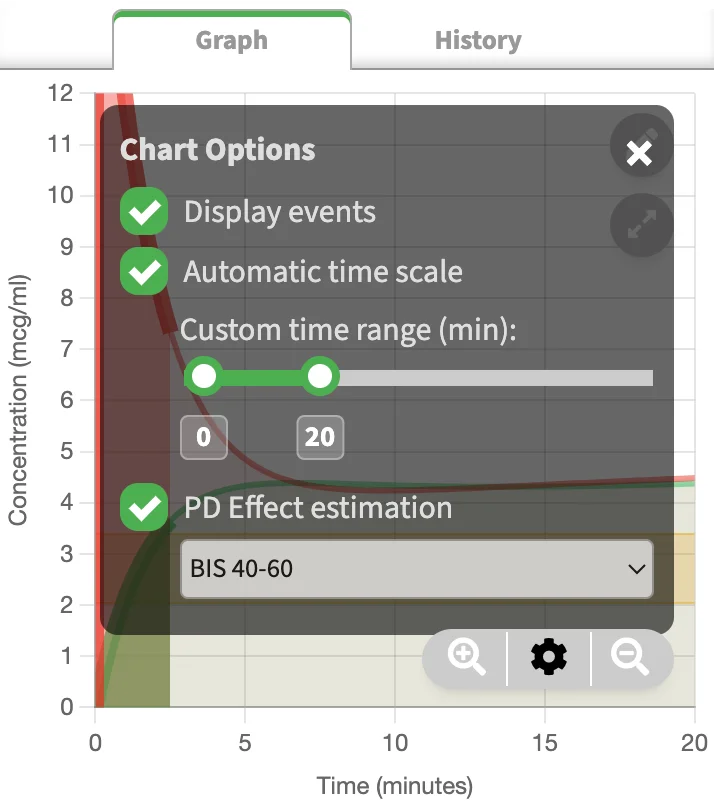
- Display events: toggle events on/off.
- Automatic time scale: the time scale (x-axis) will be automatically adjusted as time progresses.
- Custom time range slider: Use this to show more (or less) of the timeline. Adjusting this will turn off automating time scaling.
- PD effect estimation: In Eleveld propofol model, the display of BIS 40-60 margins appears. This is the range of CE values to achieve BIS 40-60. In Complex mode, 2 more options are available: "PTOL 50-90" or "NSRI 20-50" margin display.
Fullscreen graph
Sometimes, it is advantageous to hold your mobile phone sideways and maximize the graph to fullscreen. In this fullscreen display mode, the user inputs and controls, such as setting the CP/CE target or manual bolus or infusion entry fields are hidden. The important data, such as CP, CE, and infusion rate will still be displayed, on right side of screen. In addition, grey bars will appear at the bottom of the fullscreen graph to visualize the infusion rate changes over time.
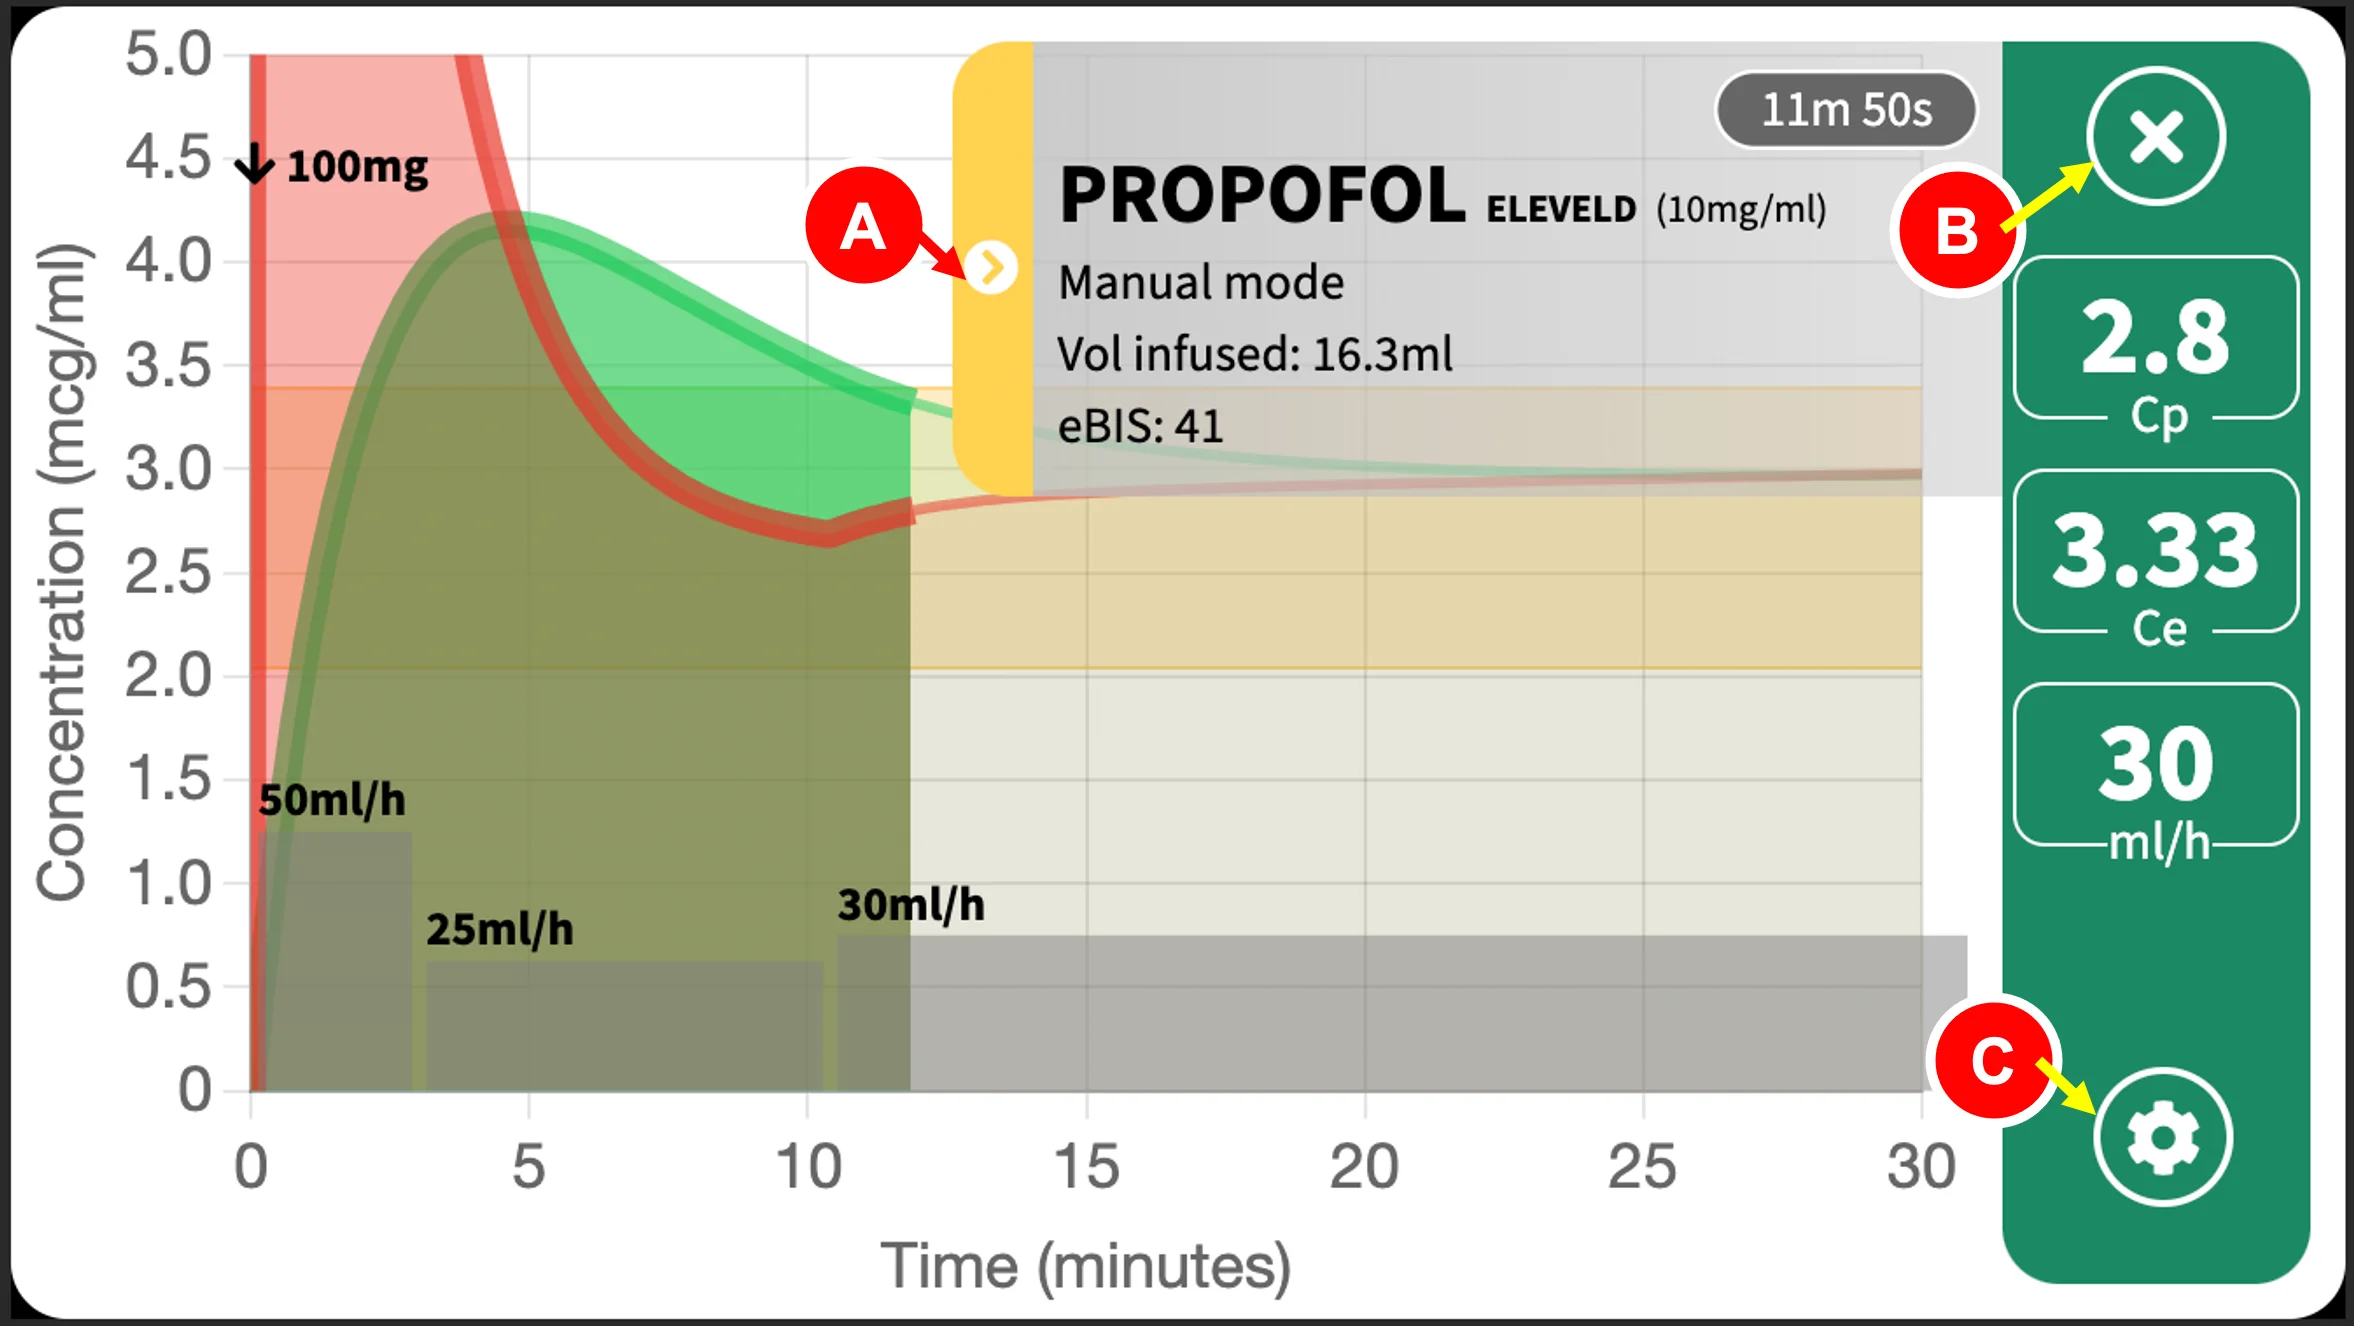
- Info box display toggle: show/hide the info box.
- Close button: exits fullscreen.
- Options button: alters the fullscreen graph settings.
iPhones & other devices
On iPhones, fullscreen mode will not automatically turn your display sideways/landscape. Please check to have auto-rotate on and turn your phone sideways. On Android, fullscreen mode is in landscape like watching a video. On most desktop browsers, fullscreen mode is supported meaning that the browser window containing the graph will be maximized.
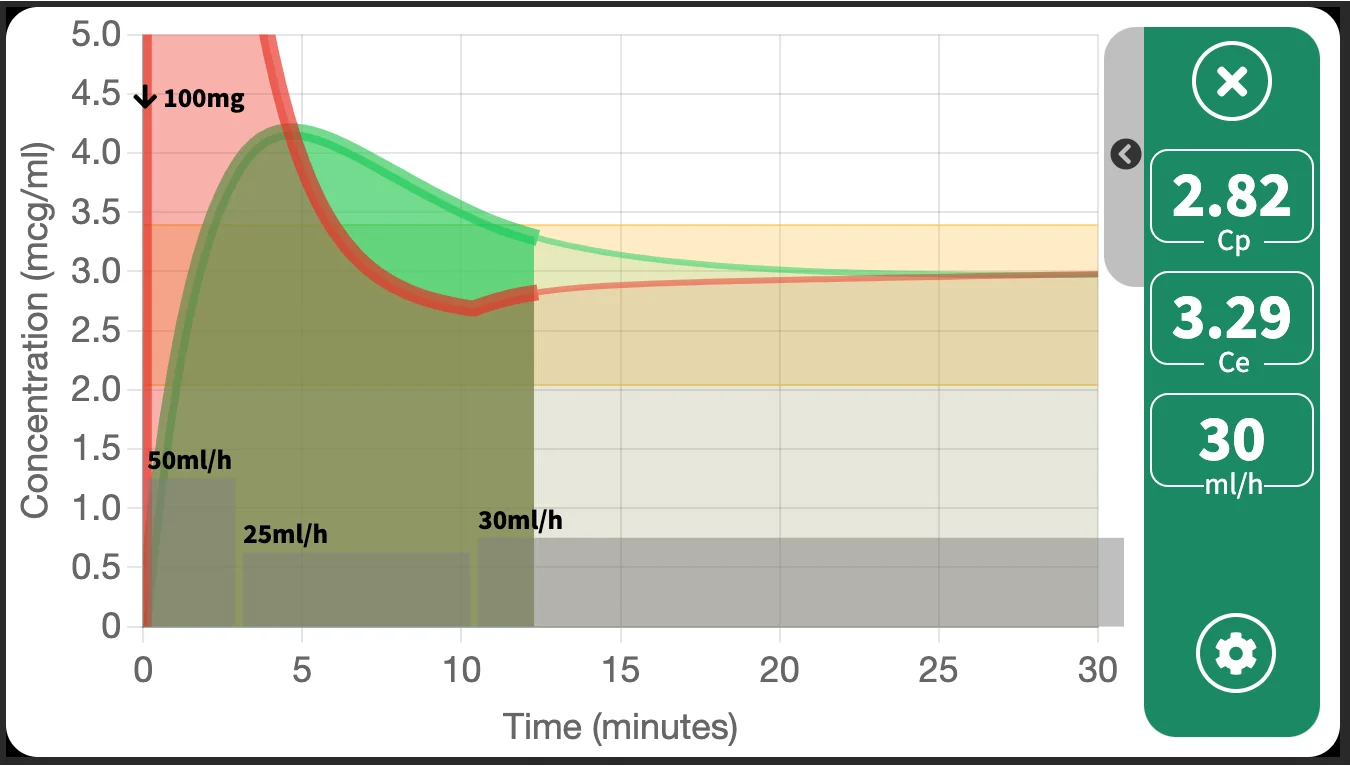
Showing/hiding the info box
An info box containing drug information is displayed by default, to show the time & infusion data. If this hinders your viewing experience or obscures your graph, you can tap on the side arrow toggle to hide it. The image below is a fullscreen graph with hidden info box.
Isobologram
The isobologram graph will be explained in detail in Chapter 8: Complex Mode.
An example of an isobologram, which explores the relationship (specifically, the pharmacodynamic synergistic interaction) between propofol and remifentanil, is shown below.
Events
Events contain small segments of text, marked at a specific time, which help you to mark important events or information on the timeline. Examples of events you may enter are: "Induction", "Loss of consciousness", "Intubation", "Woke up", or vital signs that you can enter manually.
This feature is helpful when you wish to review the case. By marking the time point, when you highlight the time using the "Quick View" feature of the graph, you can also note the CP, CE, and infusion rate at that specific time point.
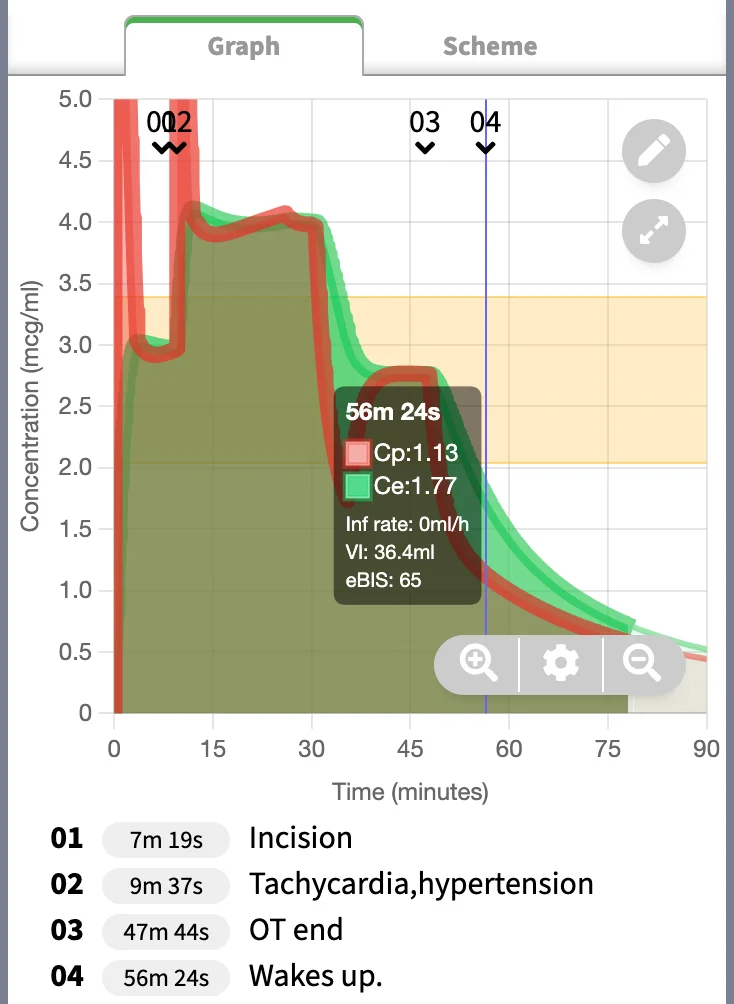
An example is shown above. Note the CP, CE, and eBIS at the point of "Waking up". The timing of this event correlates with the time highlighted on "Quick View" box on the main graph. The CE was 1.77mcg/ml, eBIS was 65 at this time point.
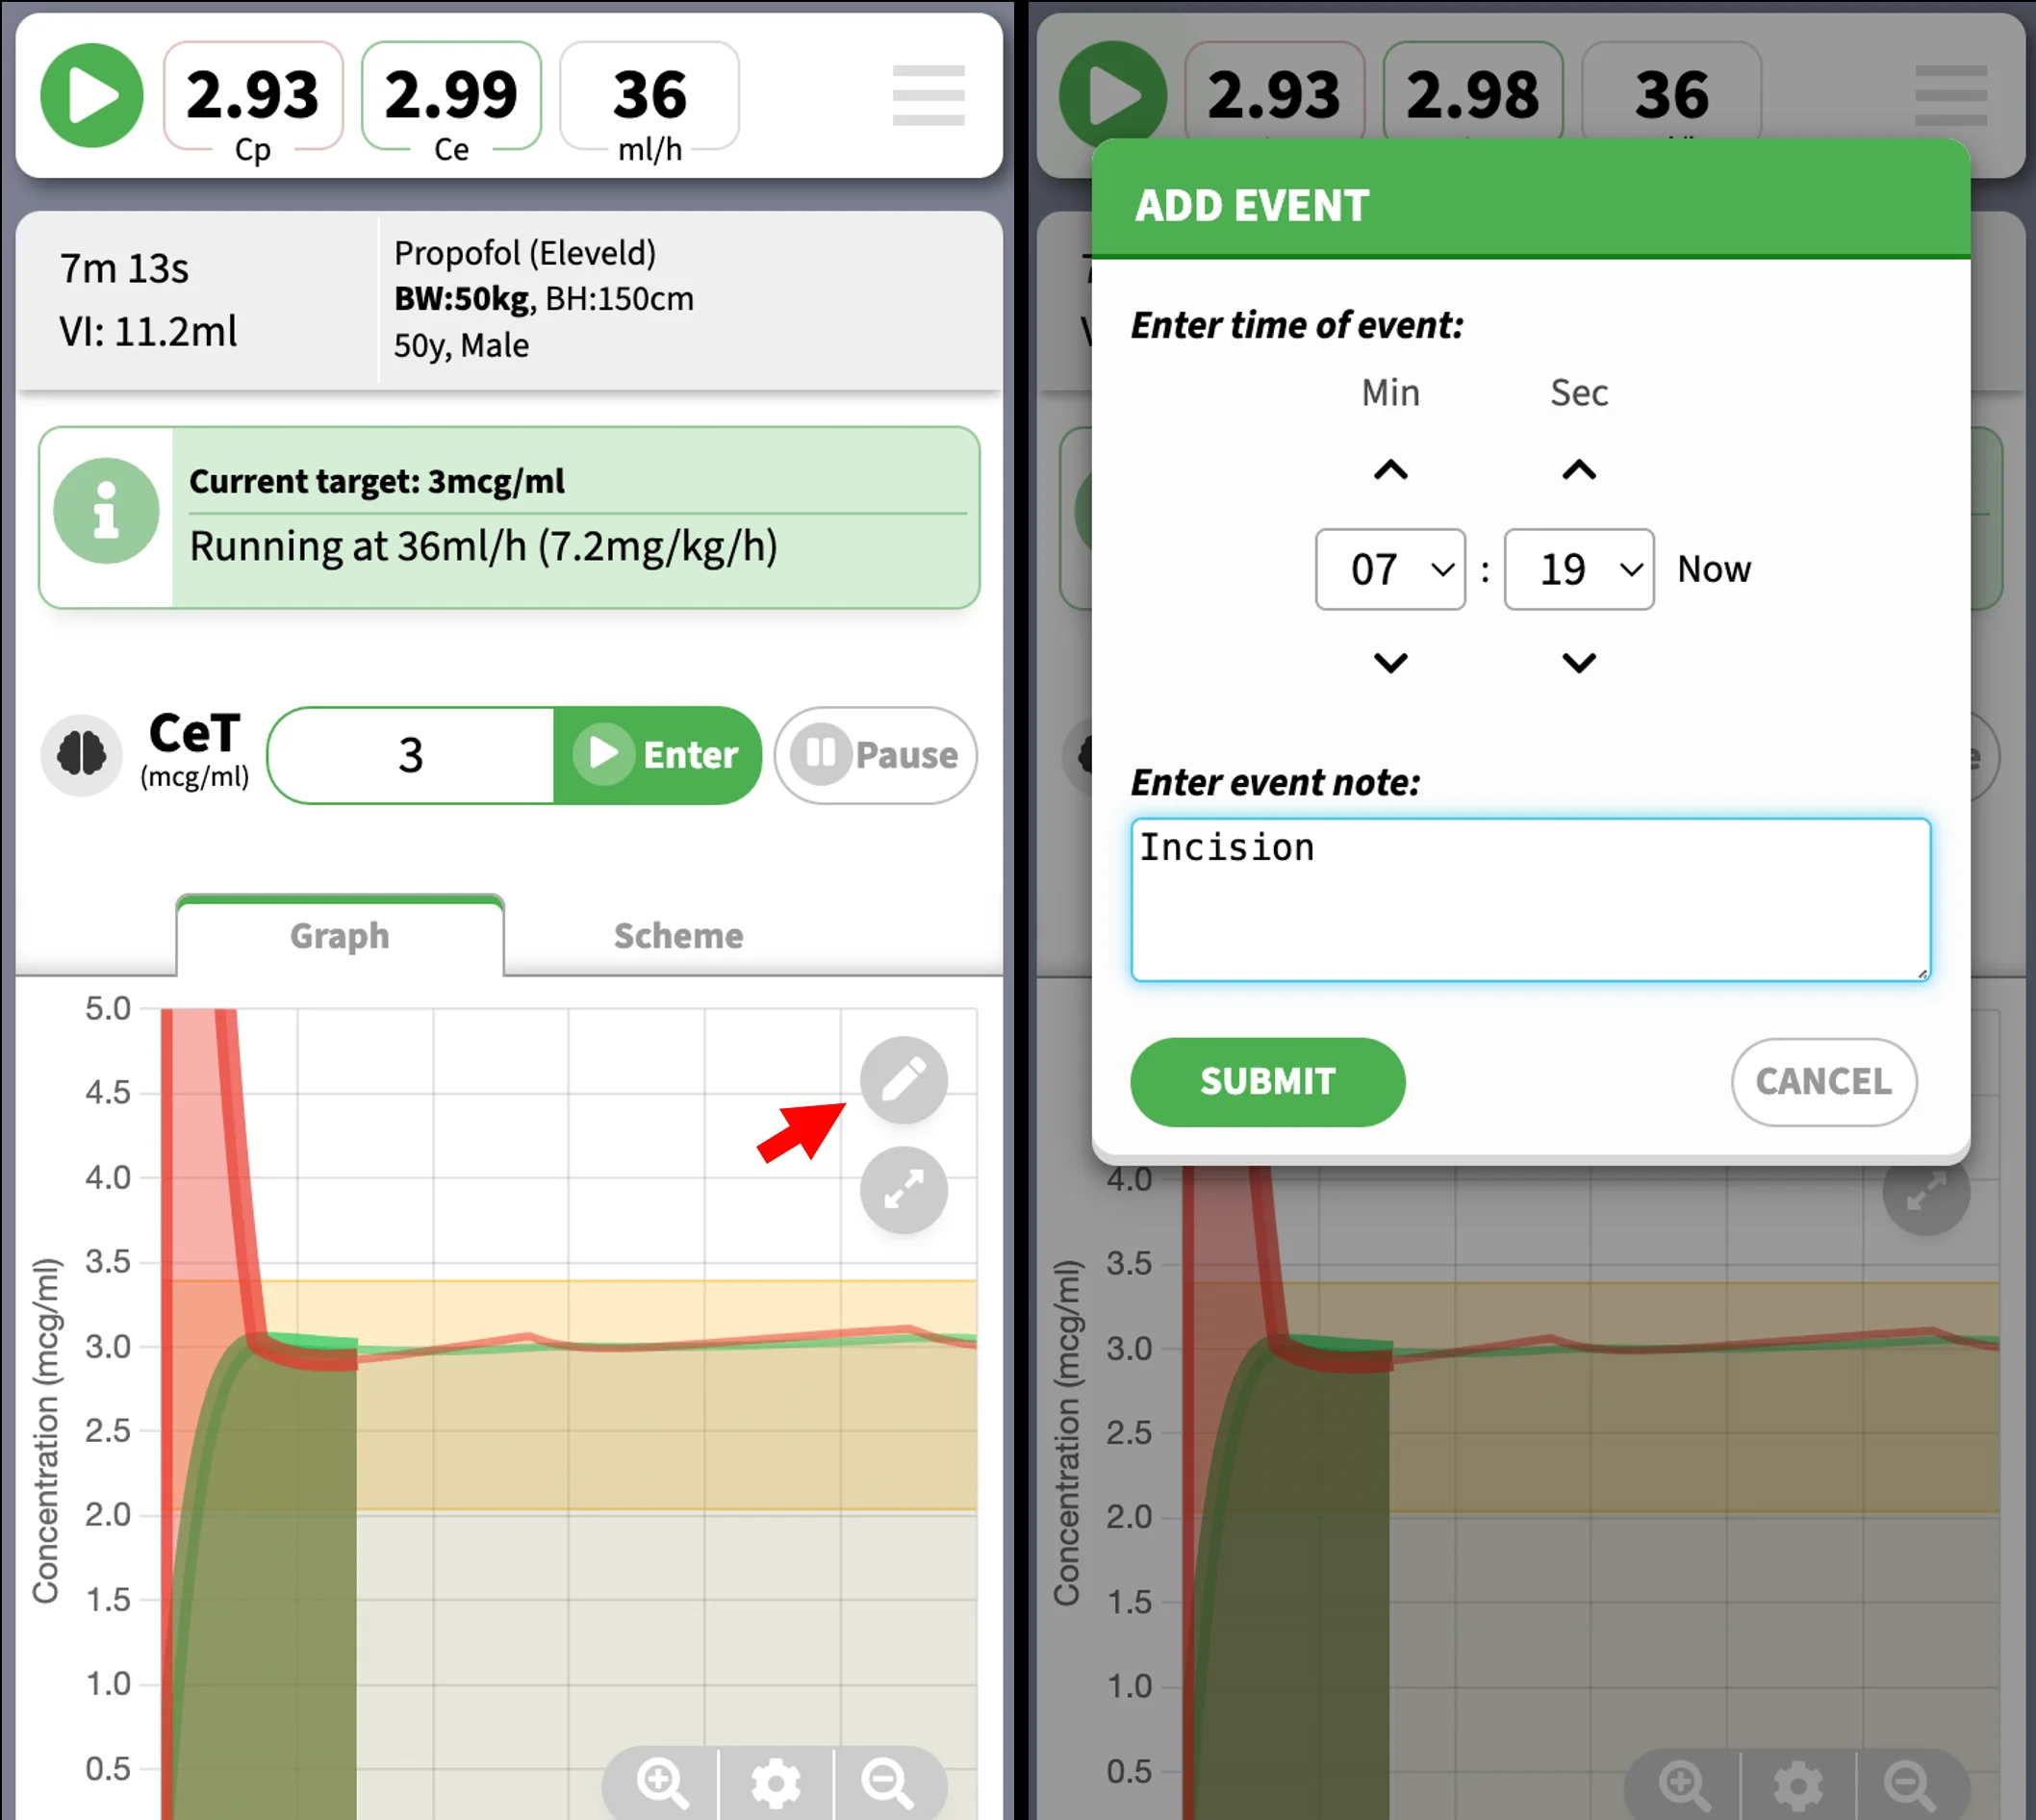
Event creation
To create an event, tap the "Event button" on the main graph. This will take you to the event creation screen. You can set the time of the event.
Event editing
The events will appear as "01", "02"... et cetera on the main graph. The respective text content will appear at the bottom of the main graph
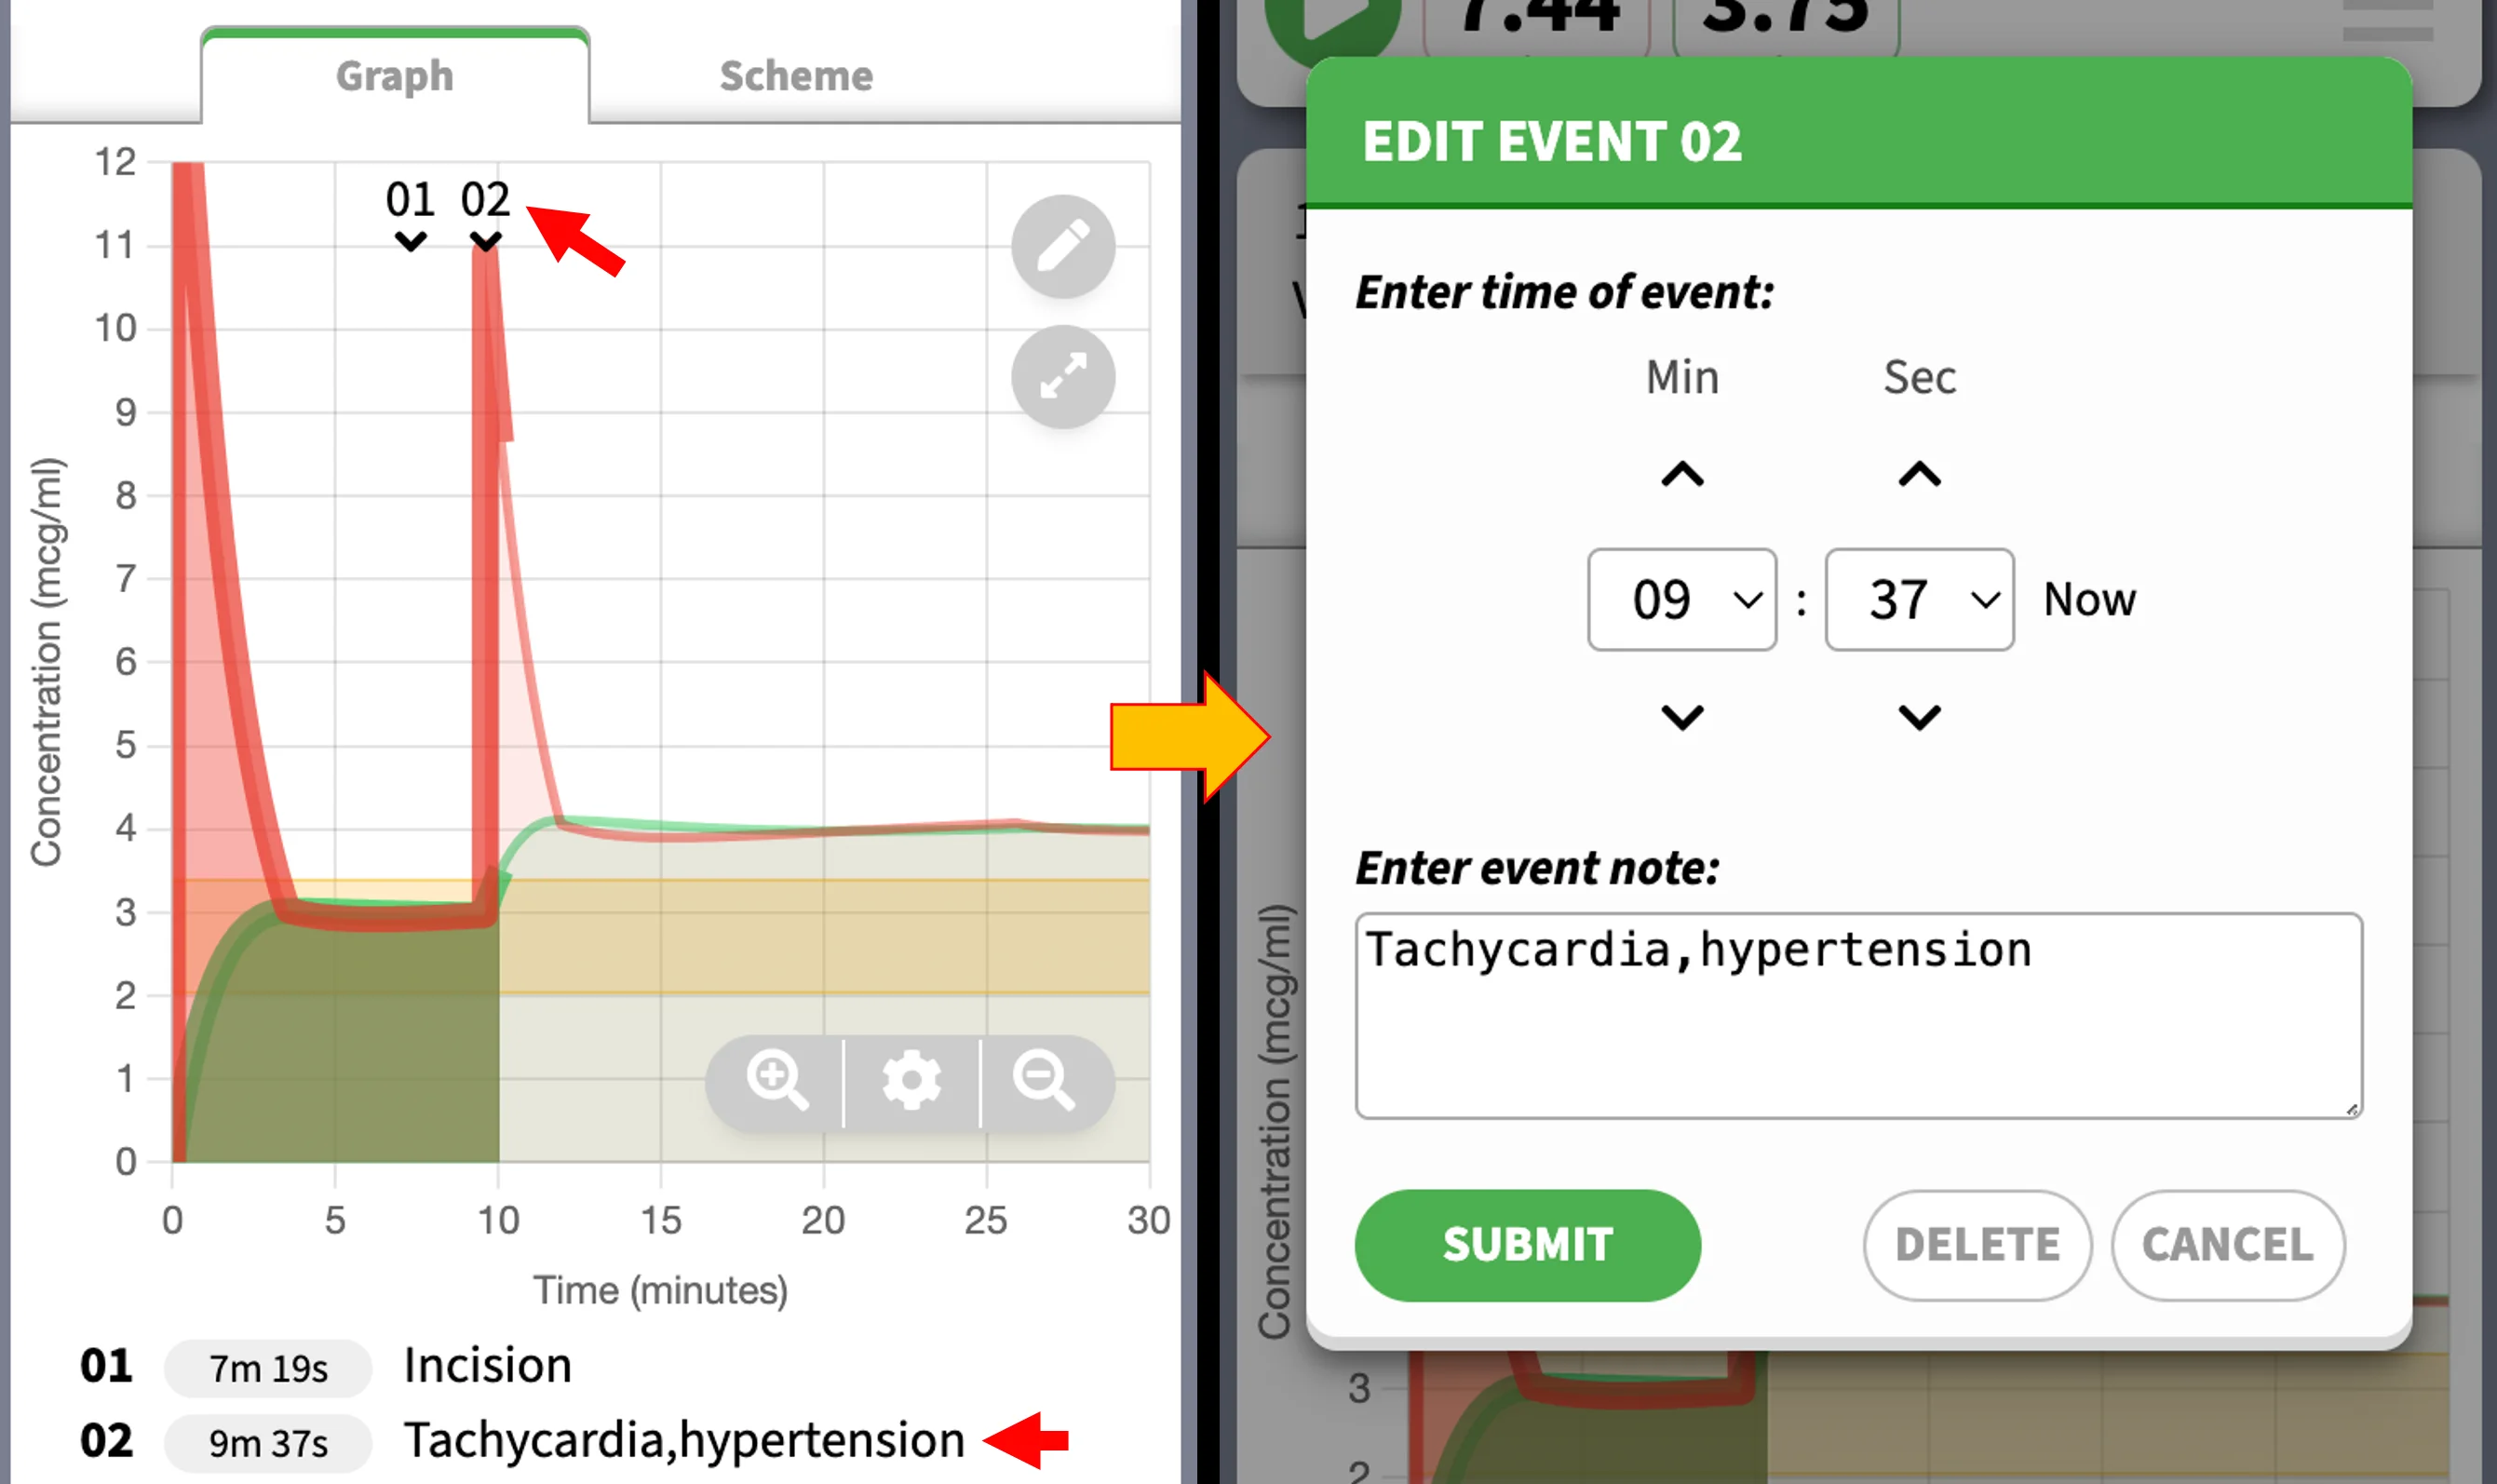
To edit the event, click on either the event marker (e.g. "02") on the main graph, or tap the event text at the bottom.
You can turn events on or off in the graph options panel, which can be accessed by the options button.
Working with Timeline
SimTIVA is designed to be run in real-time, that is, in parallel to the time course of an actual clinical case. The clock starts to tick the moment the case has started, and the CP/CE displayed at the current time point will also be the predicted pharmacokinetic status at present. However, SimTIVA also offers timeline functions as follows:
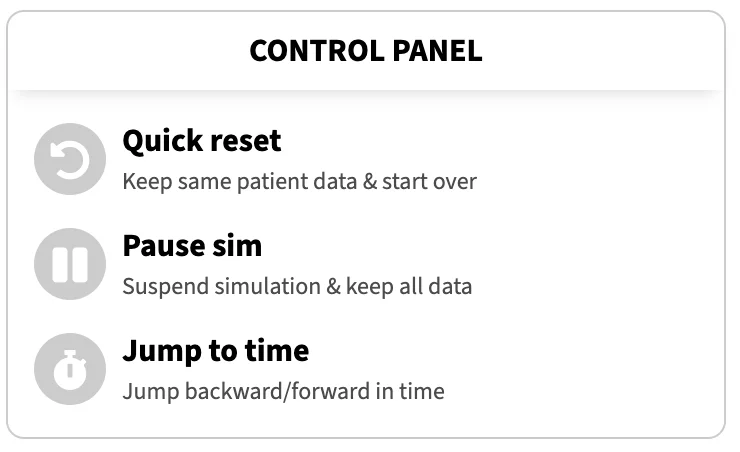
- Quick reset:
Keep same patient data and start over from time zero - Pause sim:
Suspend simulation and keep all data, this is analagous to pausing a video playback - Jump to time:
Jump backward or forward in time, like skipping to different time point of a video
The timeline functions are located in the "Control Panel" beneath the main graph.
Note that these functions will separate the simulation from working in real time, but may be advantageous in several situations. For example, you may wish to partially go back in time and try different dosing regimens by testing different infusion rates, or the effect of different doses of boluses. Or, you may have forgotten to start SimTIVA 5 minutes ago after you started actual clinical case, but you may still enter the infusion data into SimTIVA and jump forward 5 minutes and that would align the SimTIVA timeline to current time instance.
For programming complexity reasons, the timeline functions are limited to CP/CE targeting and manual infusion mode of single-drug regimen only.
Jumping to time
Opening the "Jump to time" window leads to one of the three options. You can move to a certain time point, or move back or move forward (relative to present). A time selection field is available. If the time entered is invalid, an error message will appear. Here is a video demo of the "Jump to time" feature:
1/ Time travel
— SimTIVA (@simtiva_app) February 29, 2024
Upcoming feature: restart, pause sim, & jump back/forward in time. SimTIVA is meant to be run in real-time, but this creates difficulty if u wish to simulate multiple scenarios, e.g. u may wish to start over or partially go back in time... pic.twitter.com/vmF2NqFOlA
This feature has a few limitations. One, all SimTIVA simulations have a limit of up to 6 hours. The pharmacokinetic data is generated for this finite duration, and you may not jump forward to beyond 6 hours after the last infusion scheme change.
The other limitation is that, when going back partially in time, this will also remove any rate changes (or CP/CE target changes) along the way. If you have started your infusion, and changed the infusion rate from 50ml/h to 25ml/h at 30 minutes, and if you jump back from 1 hour (origin) to 10 minutes (destination), this will remove the infusion rate change at 30 minutes.
Complex Mode
Introduction
Entering the complex (dual) mode
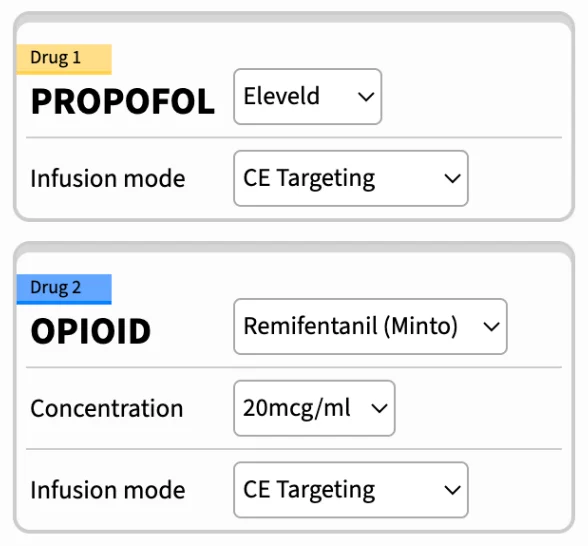
Complex (dual) mode enables the simultaneous simulations of 2 drugs: propofol and an opioid such as remifentanil, alfentanil, or fentanyl.
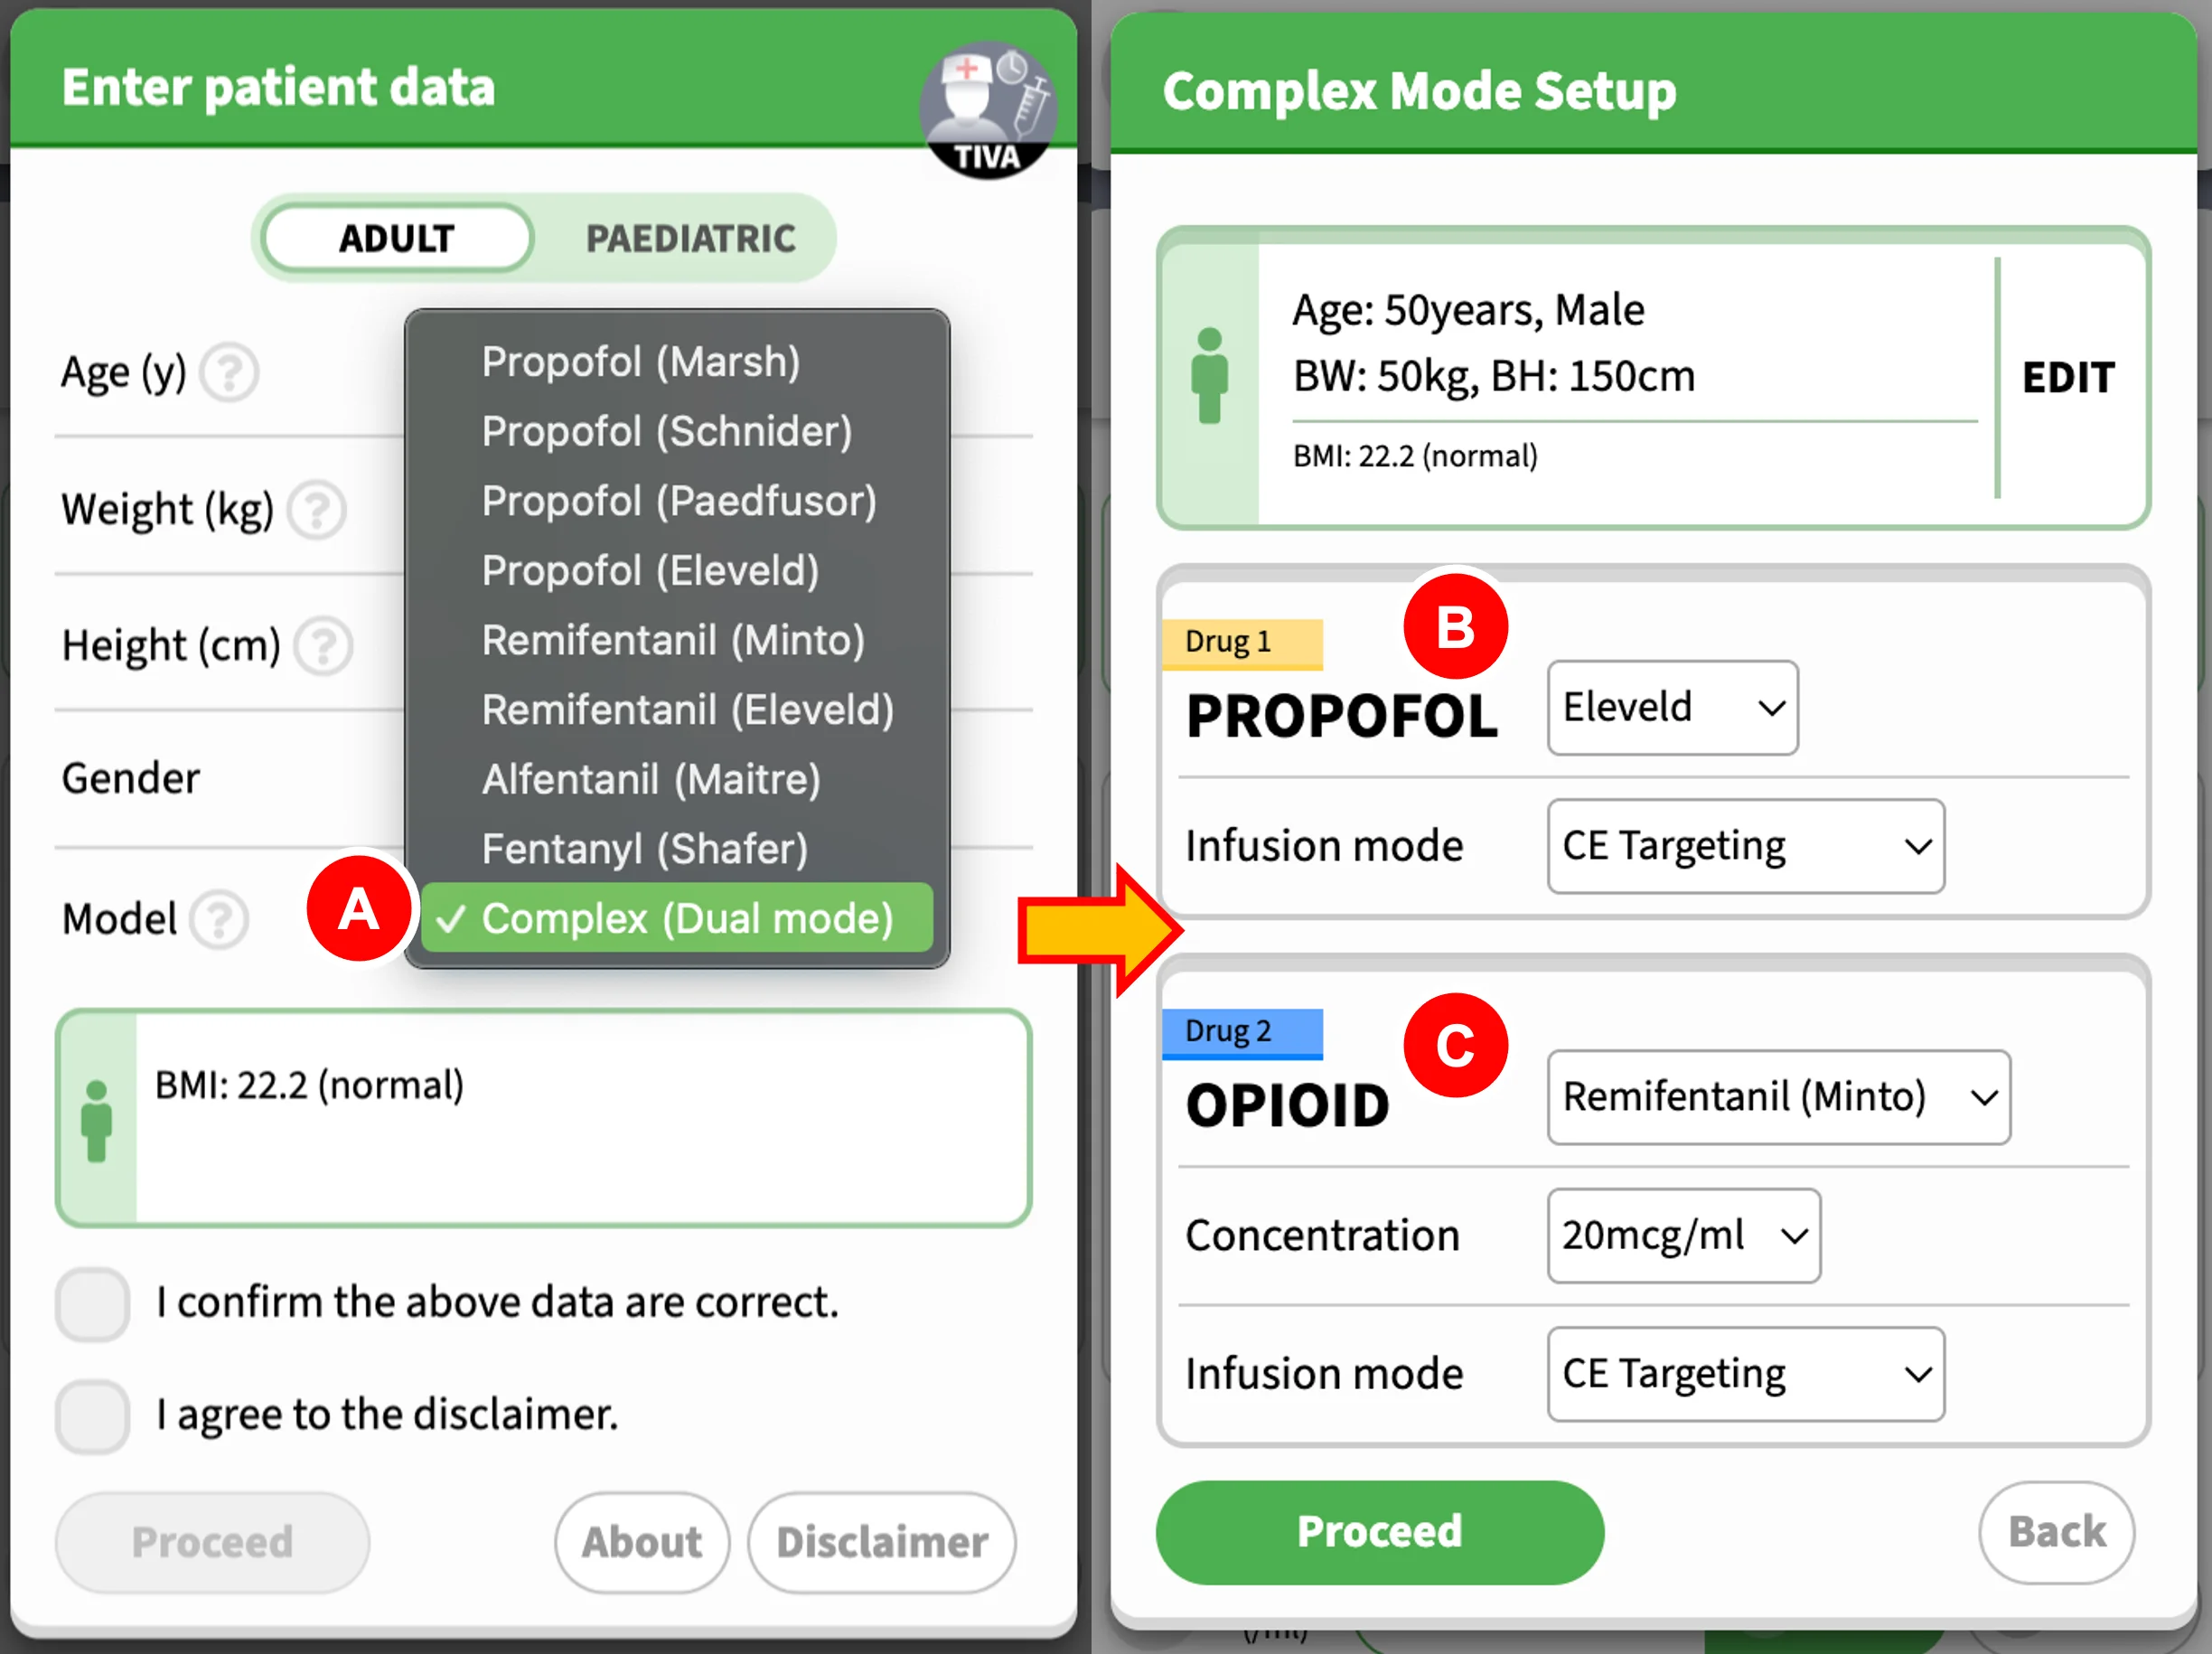
- To enter this mode, choose "Complex (Dual mode)" under "Model" on the first screen
- Then, proceed to choose the appropriate model for Propofol, and the infusion mode as well
- Next, choose the opioid & model, its dilution, and the infusion mode. Click "Proceed" after you have finished.
What is complex (dual) mode?
This mode enables the simultaneous simulations of 2 drugs: propofol and an opioid such as remifentanil, alfentanil, or fentanyl. For each drug, the functions for CP or CE targeting, manual infusion, or intermittent bolus mode are preserved. Switching between two drug infusions is simple, each drug runs on its own under their respective tabs. See the tab interface below:
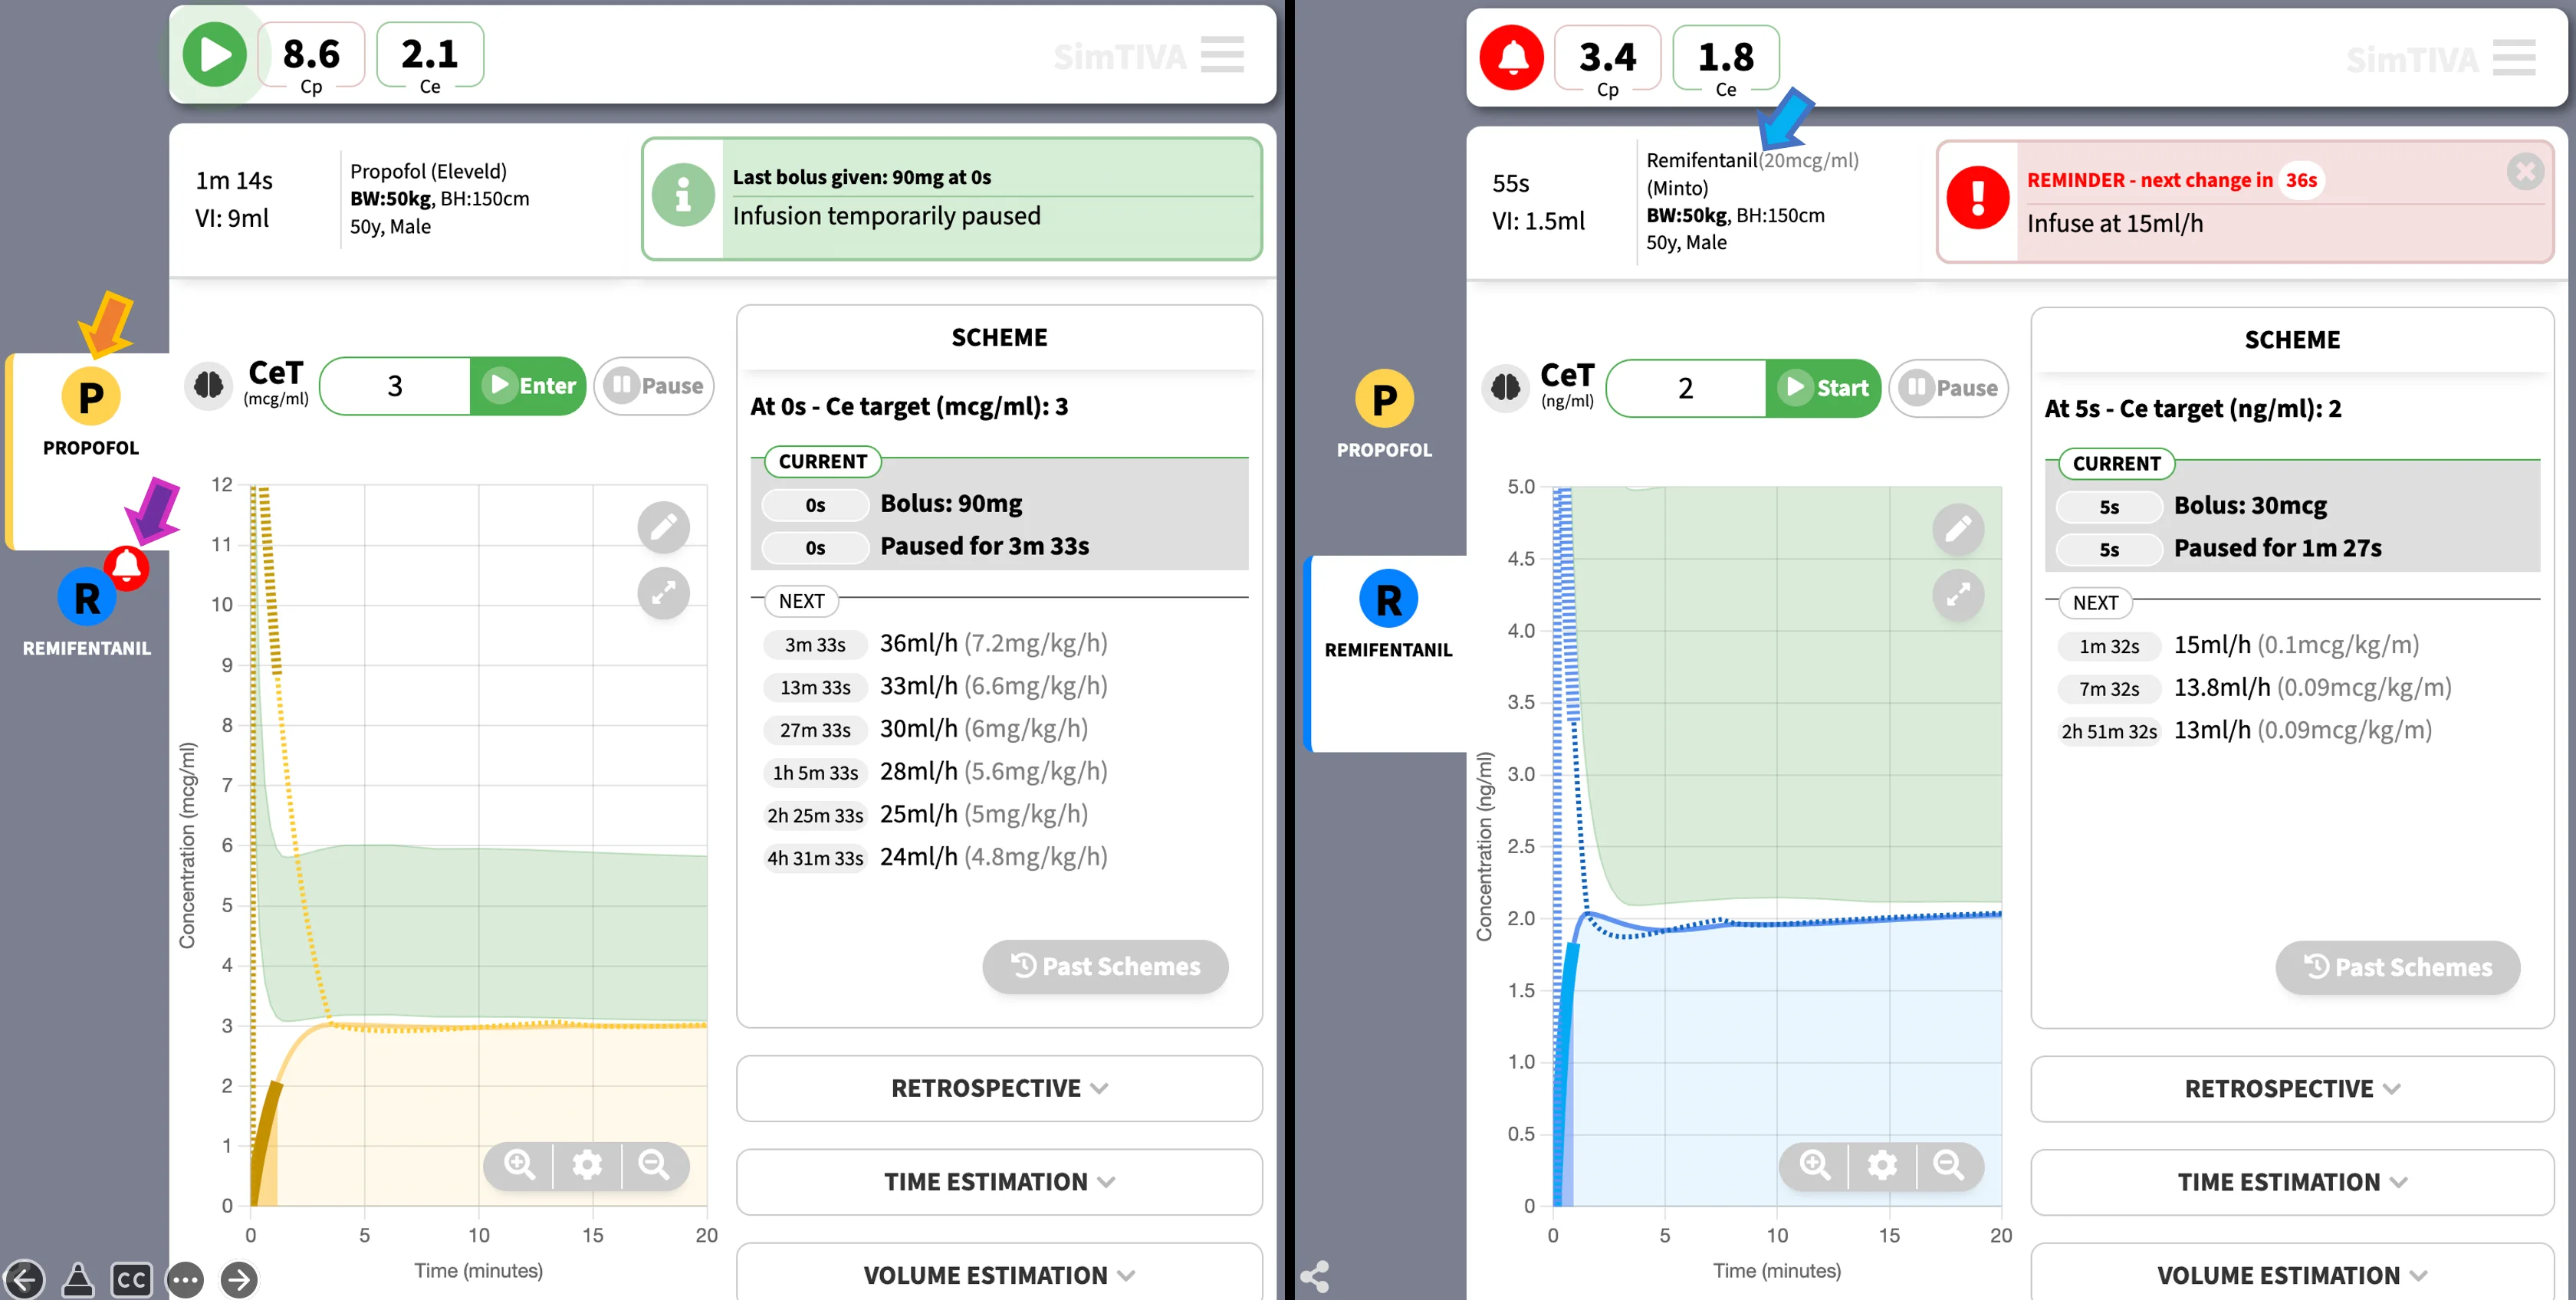
- Orange arrow: The active tab is "Propofol". This means that the current information displayed, including CP, CE, infusion rate, and the main graph, are all representing data for the propofol simulation.
- Purple arrow: When there is imminent change in the inactive tab, such as "Remifentanil" as demonstrated here, a reminder icon will appear next to the inactive tab. You may click the "Remifentanil" icon to switch to the "Remifentanil" simulation.
- Blue arrow: By clicking on the "Remifentanil" icon on the tab, you are now in the "Remifentanil" simulation. The information relevant to remifentanil will be displayed, such as the dilution and model, and other pharmacokinetic data.
In addition, you may explore the pharmacodynamic (PD) interaction between propofol and opioid, as propofol and opioid demonstrate intense synergism. This will be further explained below. Probability of tolerance to laryngoscopy (PTOL) is used as a measure of potency of propofol-opioid combination. Isobologram charts illustrate the propofol-opioid combinations to achieve the same pharmacodynamic effect.
The following are specific features of complex (dual) mode:
- In the main pharmacokinetic graph, a green zone will highlight the area bounded by the margins of PTOL50 and PTOL90. For example, in propofol simulation, the upper boundary of the green zone represents the CE-propofol to attain PTOL90, and the lower boundary of the green zone represents the CE-propofol to attain PTOL50.
- The current value of probability of tolerance to laryngoscopy will be shown in a box under the main graph. Screenshot is given below. Different options are available for this box display, namely: BIS, PTOL, and NSRI.
- An isobologram will be displayed. This shows the PTOL status (measure of mixed drug effects) in relation to CE-propofol and CE-opioid values, over time.
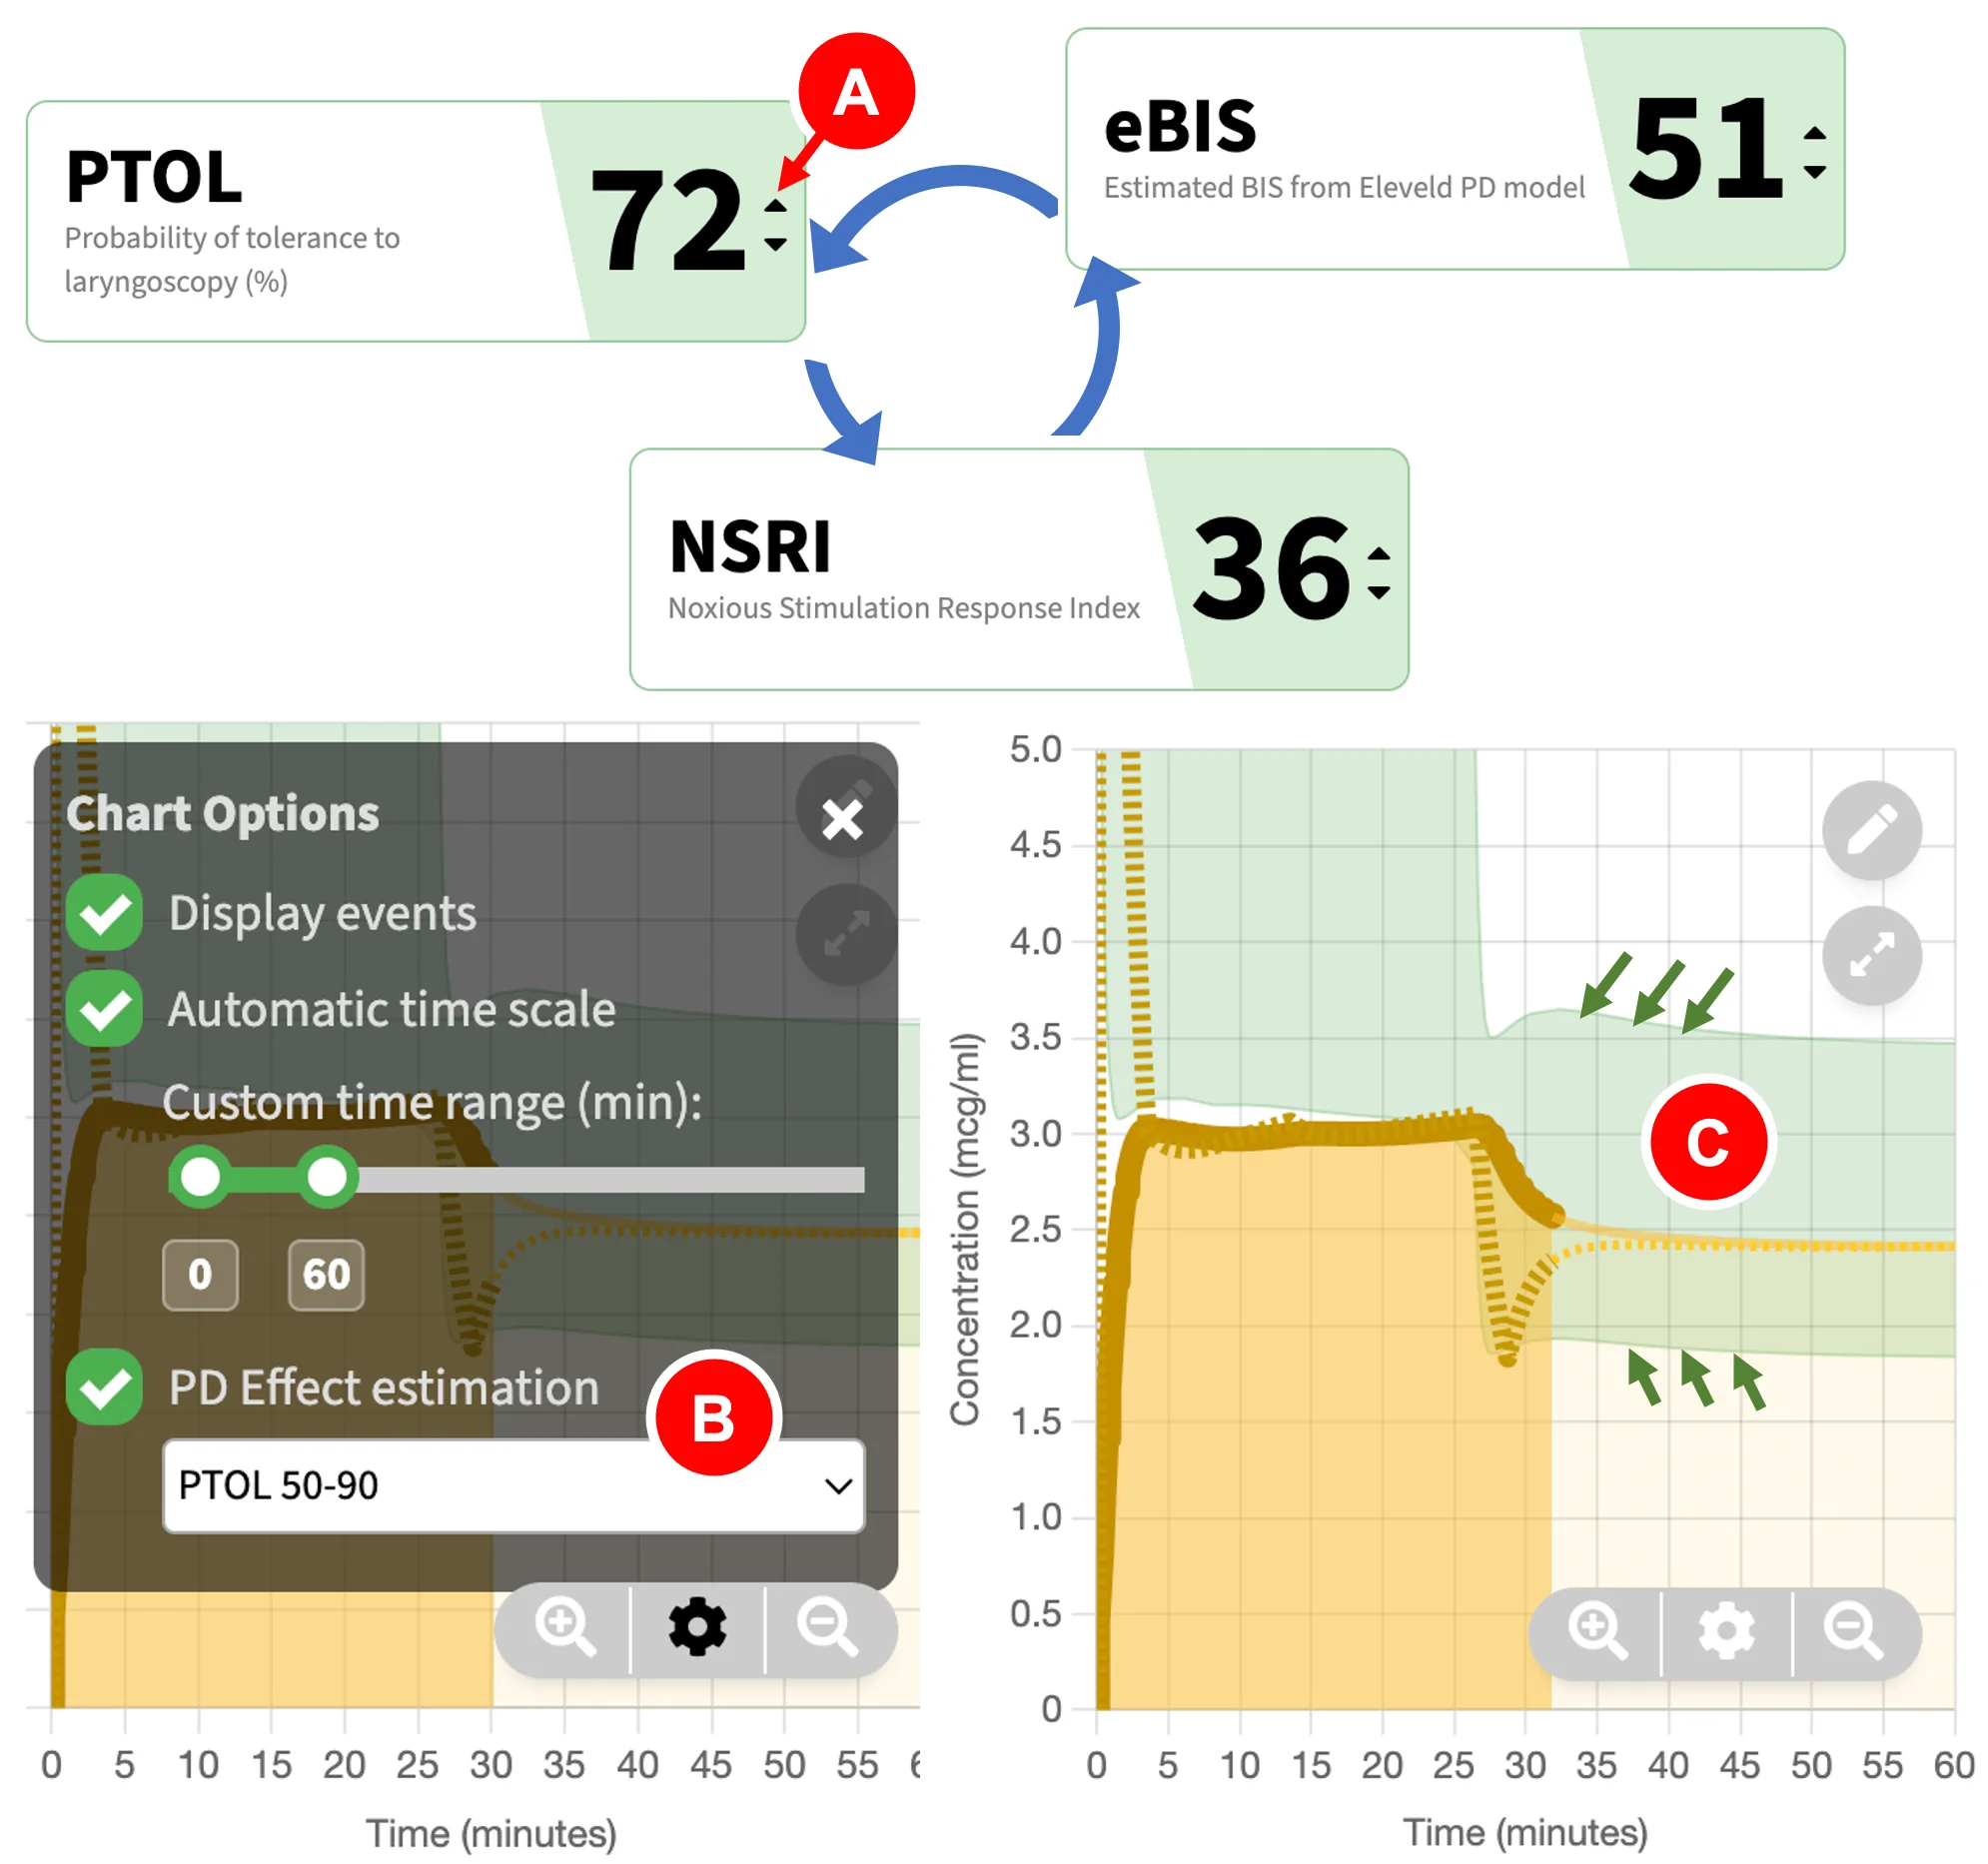
The above picture shows the display of the pharmacodynamic (PD) effect estimation mode of your choice. Three options are available: BIS, PTOL, and NSRI.
- You can click the "Quick Switch" button (red arrow) to quickly cycle between BIS, PTOL, or NSRI displays.
- Alternatively, you can change this setting under "Graph options" by clicking on the options icon then choose the appropriate PD effect estimation mode.
- The "green zone" on the main pharmacokinetic graph will update to show the margins for the upper and lower boundaries of PD effect, based on the PD estimation mode you have chosen. An example is PTOL50-90 (boundaries bounded by green arrows). This will be further explained.
Synergism
Anaesthetists often combine medications to achieve accurate level of hypnosis and analgesia, with suppression of response to noxious stimulation. In total intravenous anaesthesia, propofol and opioids such as remifentanil demonstrate intense synergism. The interaction can be quantified using a hypnotic-analgesic endpoint such as ablating movement response to laryngoscopy. Bouillon and colleagues defined this as the probability to tolerate laryngoscopy, or PTOL. PTOL was suggested as an alternative to minimum alveolar concentration (MAC) when using propofol instead of volatile anaesthesia. For decades, the interaction between propofol and opioids has been studied using various clinical end-points, for example, algometry, tetanic stimulus, laryngoscopy and response to shaking and shouting (Kern 2004, Bouillon 2004). When studying the "response" to noxious stimulation, most contemporary anaesthetic depth monitors (which focus on hypnotic part of drug effect) and more recently developed analgesia monitors, were only partially successful in the correlation with response to noxious stimuli (Hannivoort 2016).
For simplicity, SimTIVA has chosen PTOL as the measurement of choice to quantify the combined pharmacodynamic effect of propofol and opioids. This measurement is well studied in the literature to characterize the interaction between propofol-remifentanil, propofol-sevoflurane, and sevoflurane-remifentanil. Another related index, the noxious stimulation response index (NSRI), is a derivative of PTOL and a new numerical marker of depth of anaesthesia. The NSRI is scaled from 0 (indicating extensive combined drug effects) to 100 (when no anaesthetic medications are administered), and as NSRI is directly derived from PTOL using mathematical formula, NSRI and PTOL are therefore interchangeable, they merely differ in scale (Hannivoort 2016, Luginbuhl 2010). For PTOL, a PTOL of 100 means total absence of response to laryngoscopy. These measurements have been incorporated in drug information advisory displays on anaesthetic monitors. Both PTOL and NSRI can be displayed in SimTIVA as a marker of combined pharmacodynamic effect.
A good method of visualizing the pharmacodynamic interaction behaviour of drug combinations is through response surface models, which show the entire spectrum of effect throughout different combinations of anaesthetic drug concentrations. Classically, if we are studying a specific level of effect, such as a 90% tolerance to laryngoscopy (PTOL90), we can use an isobologram, which can be derived from the more complex three-dimensional response surface model. Van den Berg studied the combinations of propofol and remifentanil to achieve predicted PTOL90, using the Bouillon interaction model, as described before. Using different combinations of CE-propofol and CE-remifentanil (effect-site concentrations of propofol and remifentanil respectively), all yielding the same predicted response (90% probability to tolerate laryngoscopy, PTOL90), a line (isobole) is drawn connecting all the possible combinations of CE-propofol/CE-remifentanil to achieve the same identical effect (van den Berg 2021).
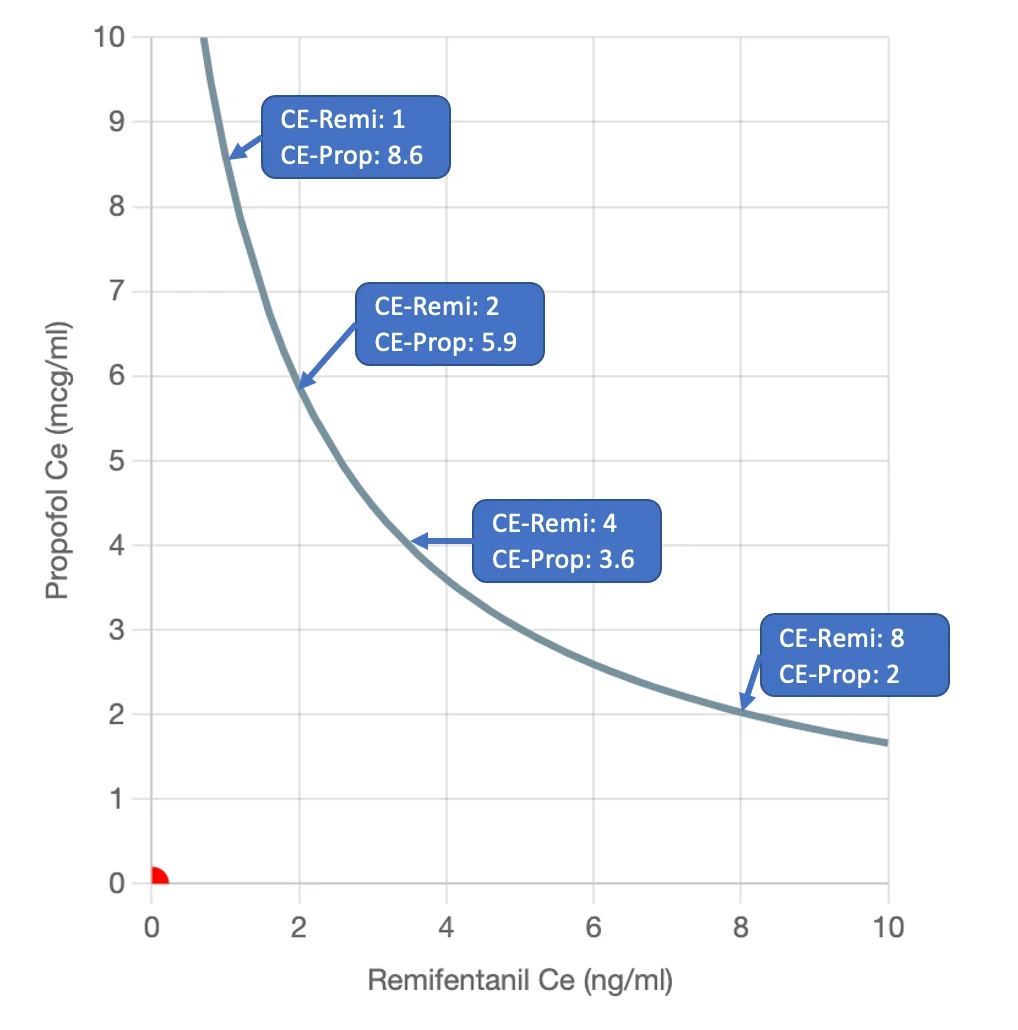
For example, 4 pairs of CE-propofol/CE-remifentanil are described to achieve this identical effect endpoint, as shown above. The clinician can then choose a particular combination that is most beneficial to different clinical scenario based on hypnotic, analgesic, and haemodynamic effects. The concept of "rational opioid selection" was also suggested by Vuyk in 1997, that using an opioid as an adjuvant of anaesthesia, the required propofol concentration can be reduced and this can possibly reduce the time of return to consciousness. Vuyk also described an optimal CE-opioid that can maintain adequate anaesthesia, while maintaining rapid wakeup through reduction in propofol requirements. In practice, the clinician may reduce propofol concentration and increase remifentanil concentration to hasten emergence from anaesthesia.
The conversion of CE-remifentanil to two different opioids available in SimTIVA: CE-alfentanil and CE-fentanyl is based on opioid potency equivalence and the formula suggested by Vuyk, as given here: potency ratio of fentanyl:alfentanil:remifentanil was 1 : 1/70 : 1/2.3.
Isobologram Interpretation
The isobologram in SimTIVA contains 9 isoboles from PTOL10 to PTOL90. As mentioned before, using different combinations of CE-propofol and CE-remifentanil (effect-site concentrations of propofol and remifentanil respectively), all yielding the same predicted response (90% probability to tolerate laryngoscopy, PTOL90), a line (isobole) is drawn connecting all the possible combinations of CE-propofol/CE-remifentanil to achieve identical effect. The same method is repeated for PTOL80, PTOL70... PTOL10 to generate a total of 9 isoboles on the 2-dimensional chart. The contour of the isoboles is typical of synergism, or supradditive interaction.
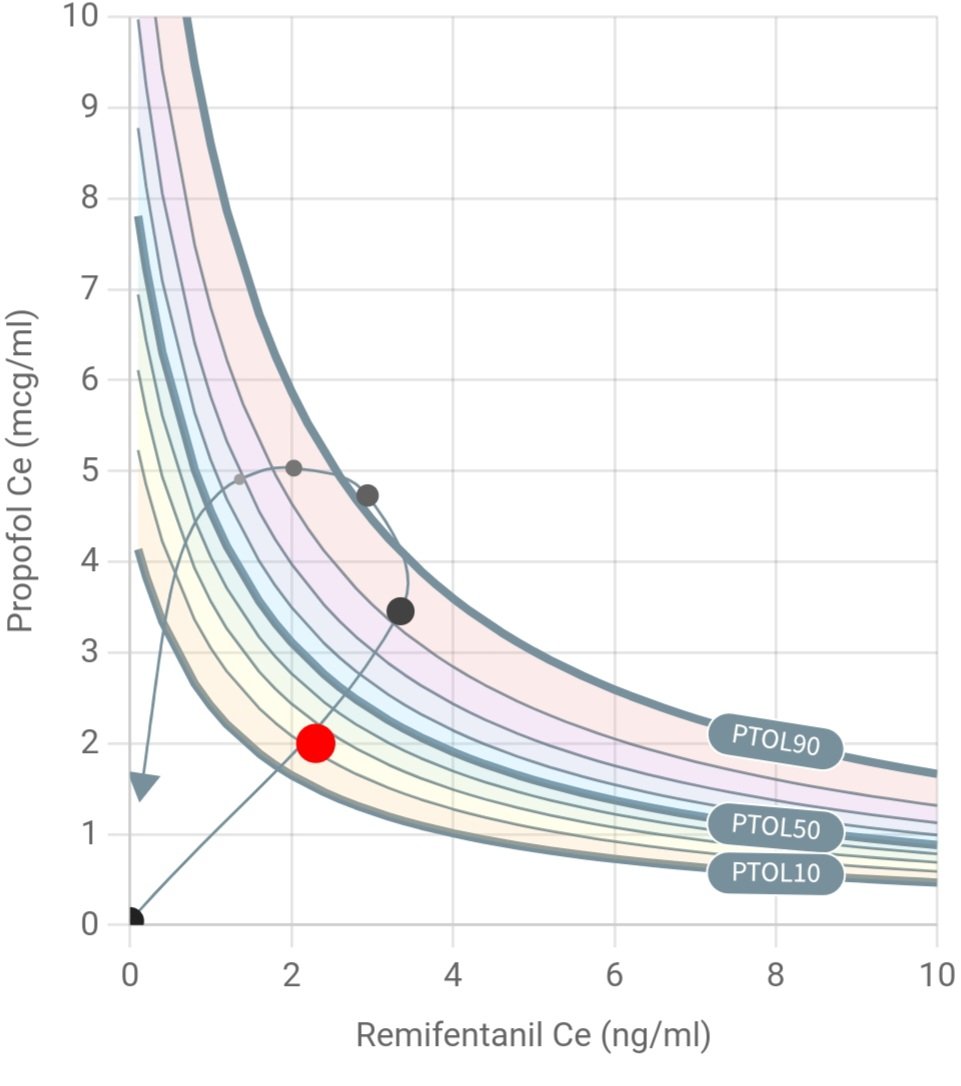
How to read the isobologram in SimTIVA
- X-axis: CE-opioid
- Y-axis: CE-propofol
- Red dot: Represents the current time instance - the x- and y- values are CE-opioid and CE-propofol respectively.
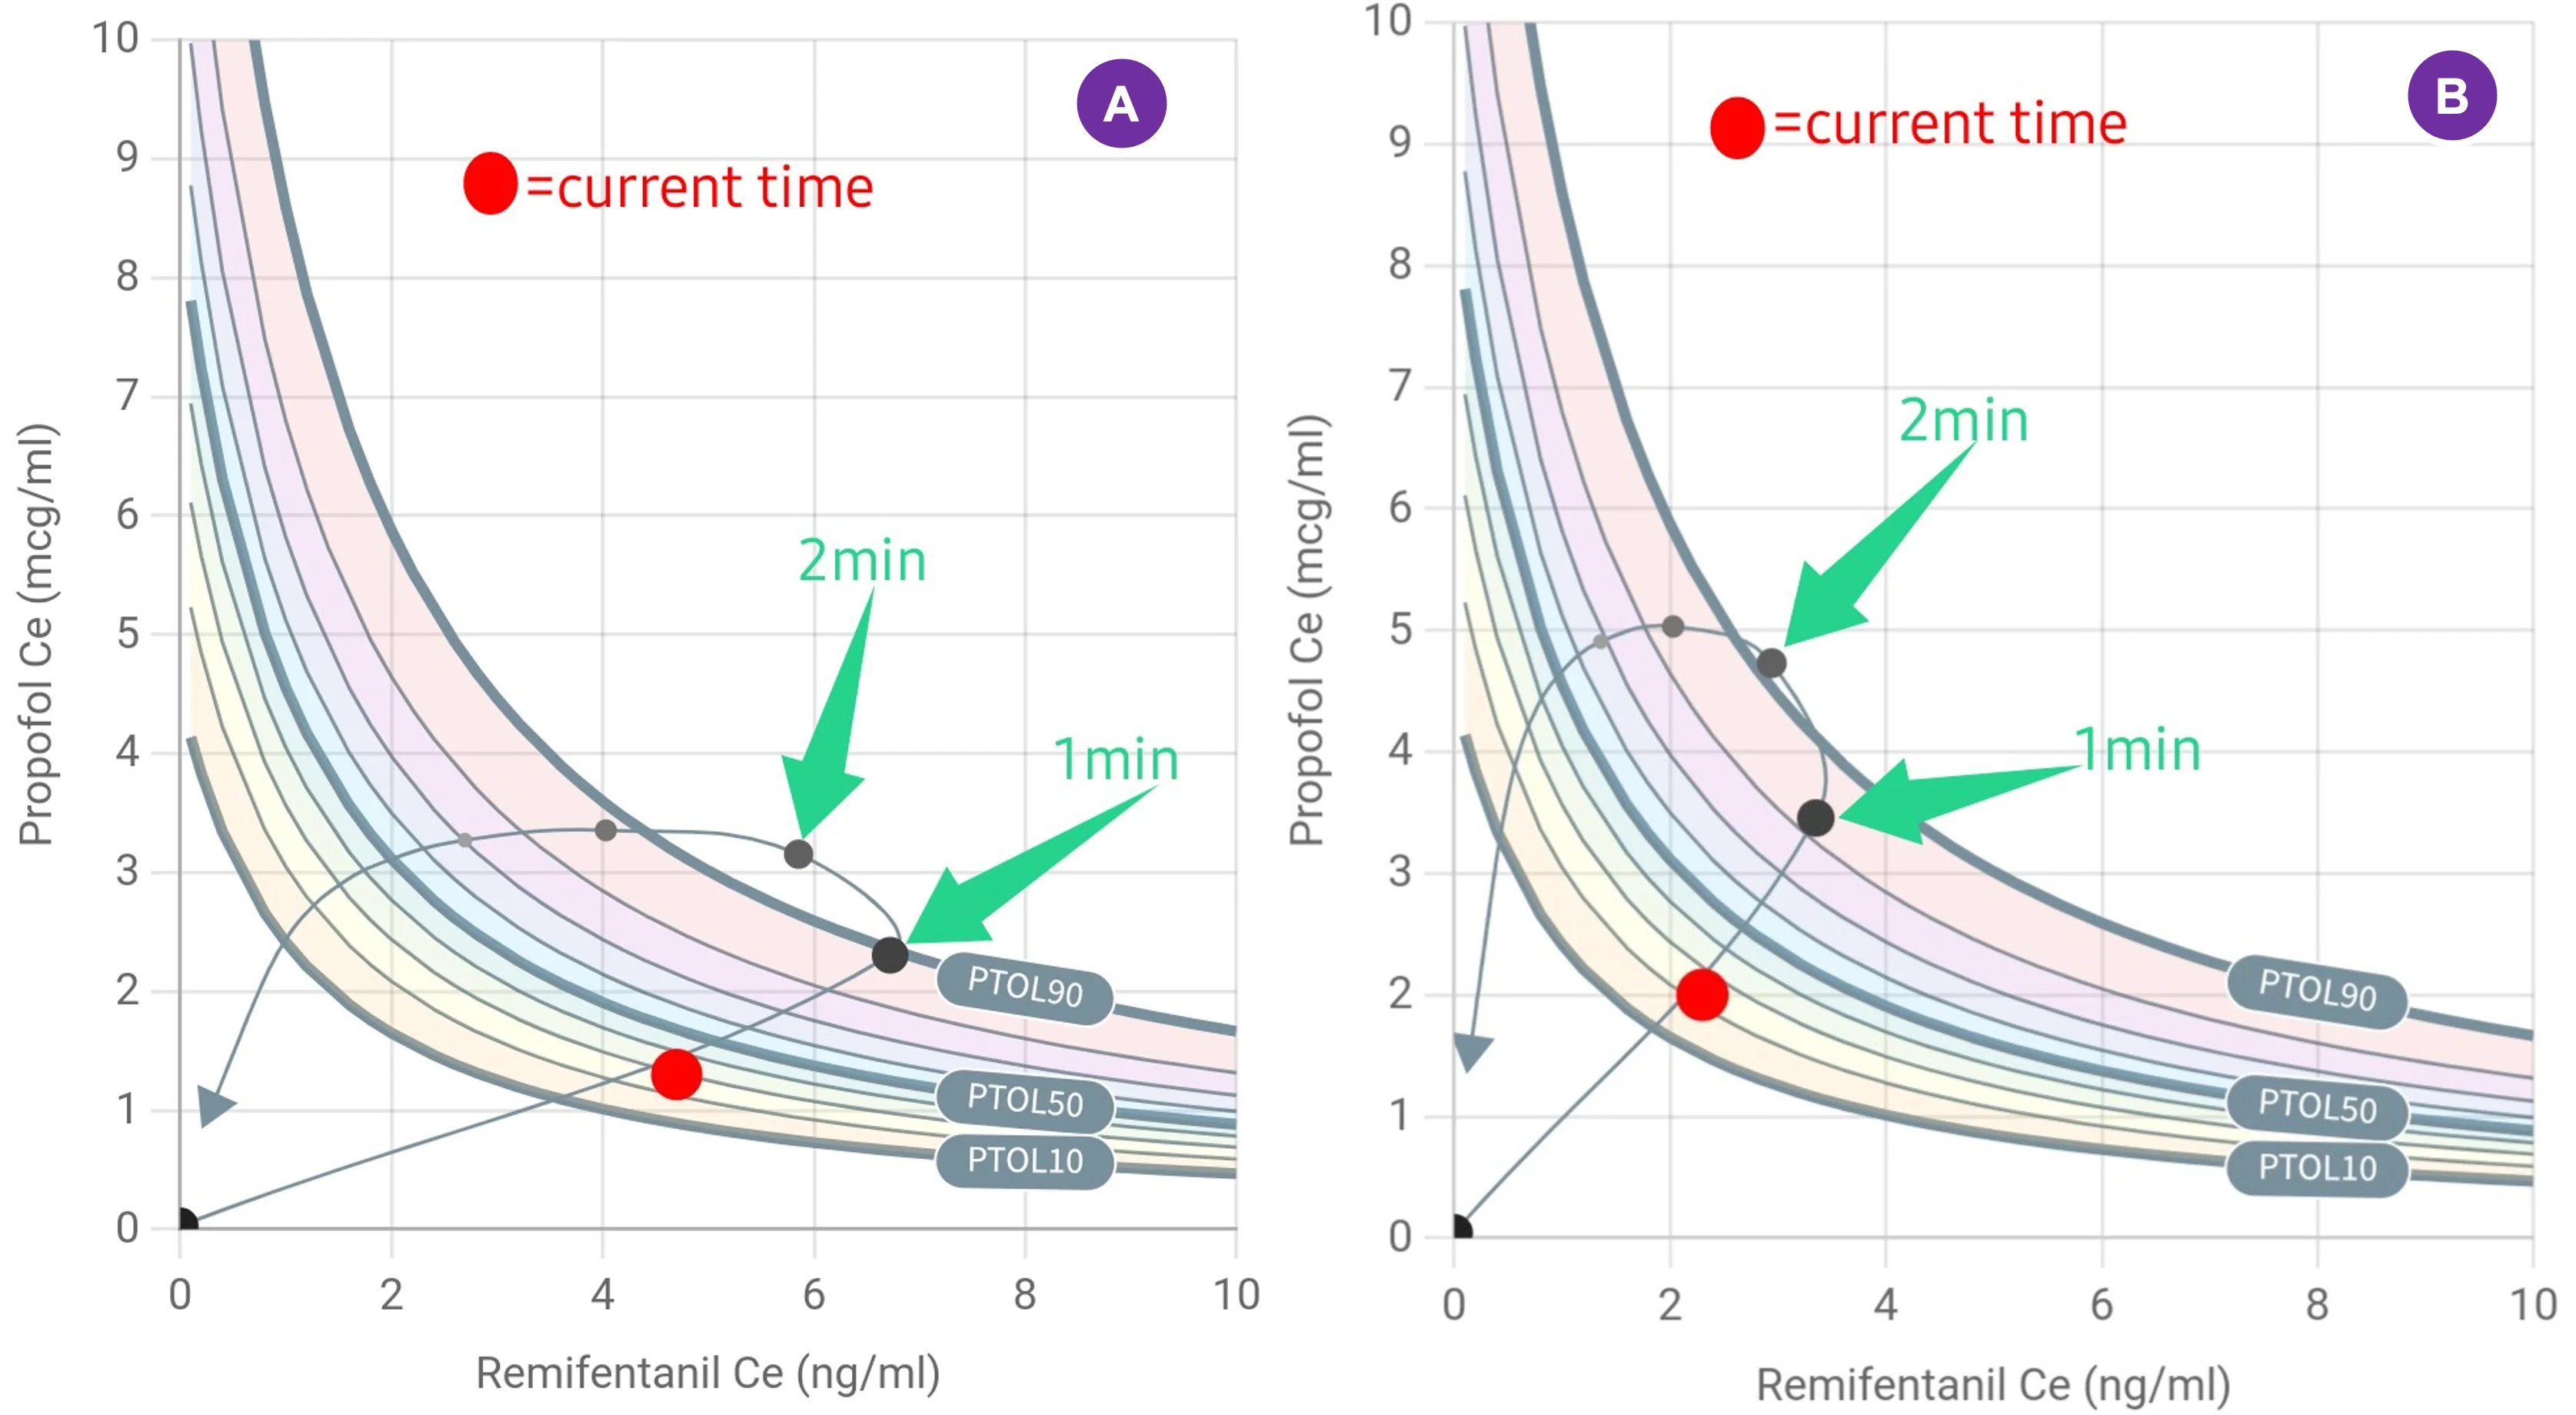
- Isobole lines: total of 9 isoboles displayed, the PTOL90, PTOL50 and PTOL10 lines are labelled for reference.
- PTOL trend line: A line representing the past, present, and future PTOL values over time of the current case. Every grey dot represent 1-minute intervals before and after current time.
- Arrow: PTOL value 20 minutes into the future.
In the above example, propofol 240mg bolus and remifentanil 50mcg bolus were given in an 80kg patient in a "dual mode" simulation. The resultant CE-propofol & CE-remifentanil values over time (the curved trend line) are plotted within this 2-dimensional space, overlapping on the isobole lines. The red dot represents the current time, with a PTOL of around 23%.
Examples
Example 1 - More propofol or more remifentanil for induction?
To illustrate the application of "Complex (Dual mode)", the first example is given. Imagine a patient of 35 years old and 80kg body weight receiving propofol bolus and remifentanil bolus for induction. Two regimens are tested:
- (A) Propofol 160mg and Remifentanil 100mcg
- (B) Propofol 240mg and Remifentanil 50mcg
Both of these regimens can attain good intubating conditions (PTOL 90%) at 1m and 1.5m respectively. You can replicate the above scenarios using "Complex (Dual mode)", and select "Propofol-Eleveld" model and "Manual mode" as well as "Remifentanil-Minto" model and "Manual mode" in SimTIVA.
Example 2 - Propofol and remifentanil infusions
In this second example, propofol (Eleveld) and remifentanil (Minto) simulations were running in manual mode. Initially, BIS is chosen as PD effect estimation mode, and the green zone on the main graph of propofol simulation corresponds to CE required to achieve BIS 40-60. Then, the user has switched PD effect estimation to PTOL, which will also update the green zone on the main graph, which now highlights the CE values to attain PTOL50-90. In this example, because of falling remifentanil concentration post-induction, the PTOL was predicted to drop below 50% at around 7.5min. The anaesthetist should be aware of this and titrate the dosages accordingly to maintain adequate anaesthesia.
Towards the end of the video demonstration, the isobologram is shown. The current PTOL value was represented by the red dot, and the past and future PTOL values were plotted as a trend line curve. The user then switched the PD effect estimation mode to NSRI, using the "Quick Switch" button.
(4/5)
— SimTIVA (@simtiva_app) September 16, 2023
When is anaesthedia "too deep" or "too light"? https://t.co/KXov8b2dRM enables PD modelling & displays a "green zone" to mark the CE margins required to achieve PTOL50-90. In this example, CE is in the green zone but is predicted to fall below PTOL50 margin beyond 7.5min pic.twitter.com/KJ0ICsQdeT
Share Function
How to use the Share Function
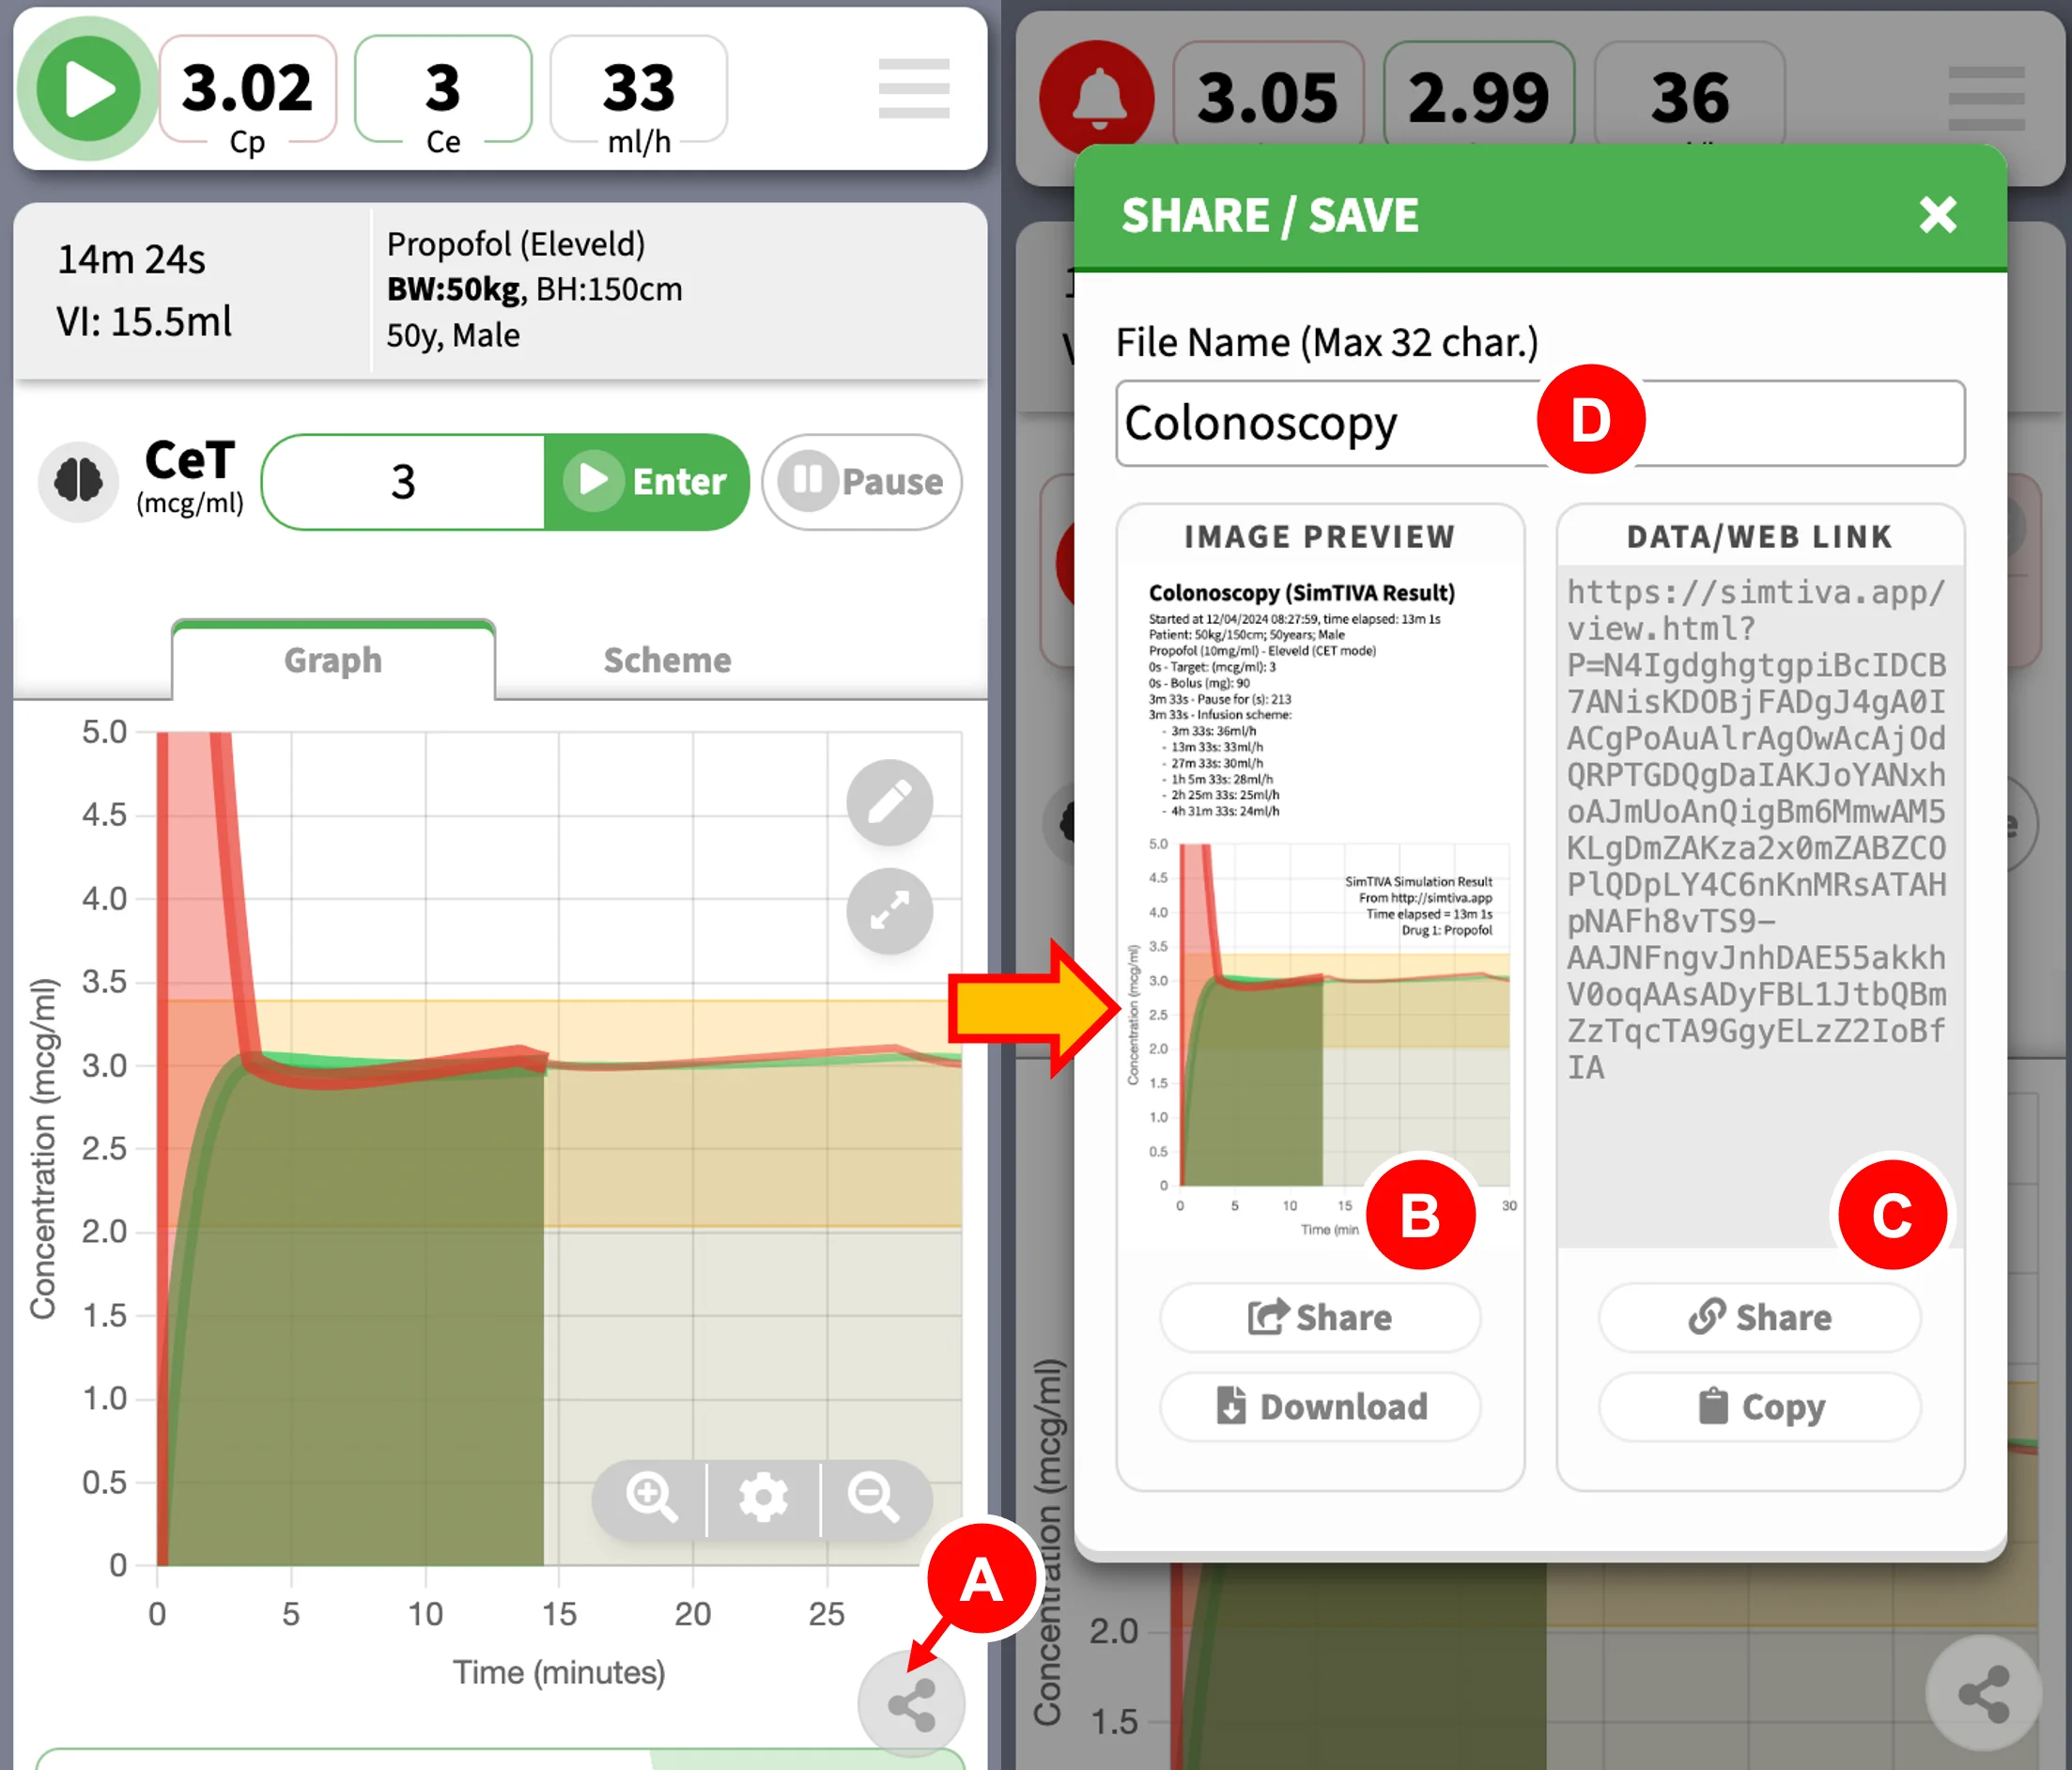
To open the "Share" panel, click the Share button (A) on the right lower corner. SimTIVA allows you to share your simulation in two ways. One, you can share a static image (B), which will contain the main pharmacokinetic graph, the infusion scheme, and events. Two, you can share an interactive SimFile (C) which can be viewed by the online SimTIVA Viewer; via this function, you can either share this SimFile as a website link (weblink for short) on desktop PCs or quickly share this directly on your mobile devices.
- Share button
- Share image (left side of panel)
- Share weblink (right side of panel)
- File name entry box
You can also specify a "File Name" (D) to help identify this SimFile for record keeping. The same file name will be used as the SimFile saved locally on device, which you can later load and review - see next Chapter for details.
Share Image
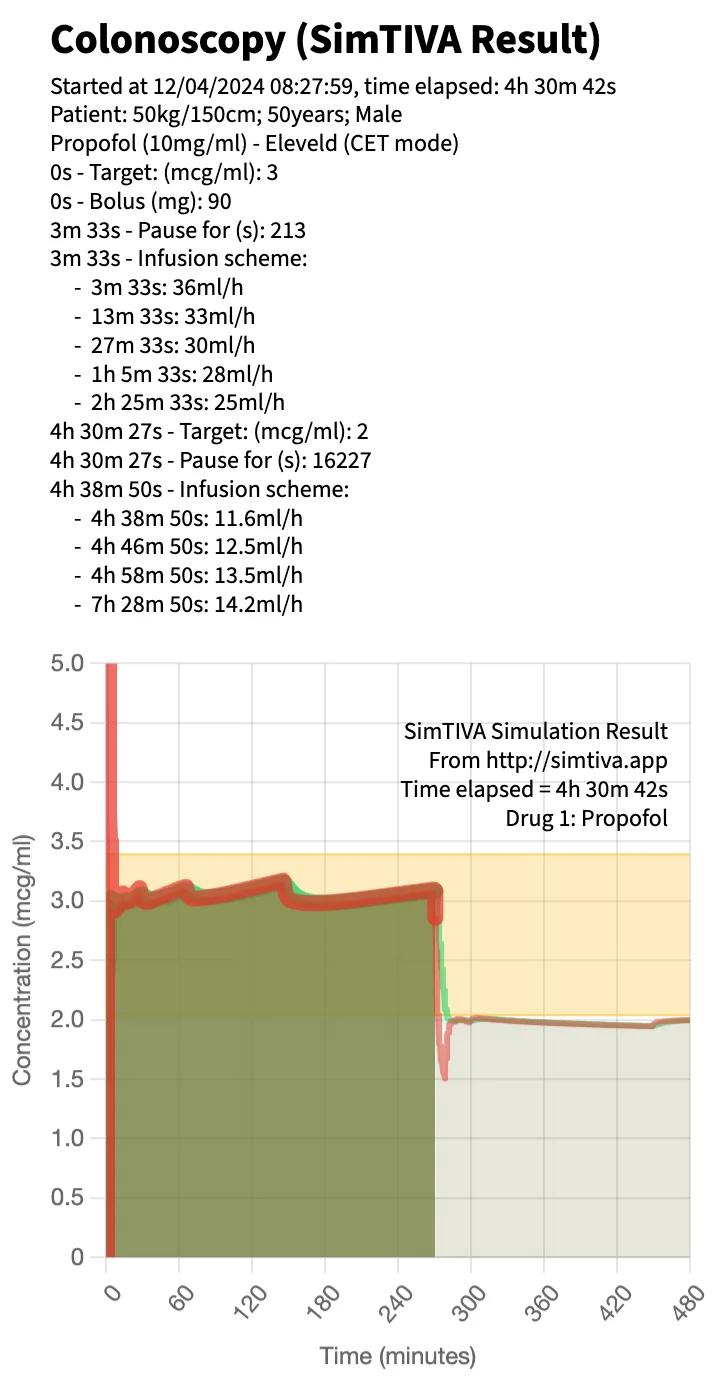
This function is ideal for visualizing an overview of your case or inserting it as an image for your presentations. As mentioned, this function generates a static image of the current simulation at the current time point (it automatically updates while SimTIVA is running). In the single-drug mode, a sample image is shown below. Aside from pharmacokinetic data, the File Name and the date and time of starting simulation will be displayed. You can choose to "Download" the image on desktop or mobile devices, or "Share" it on mobile devices.
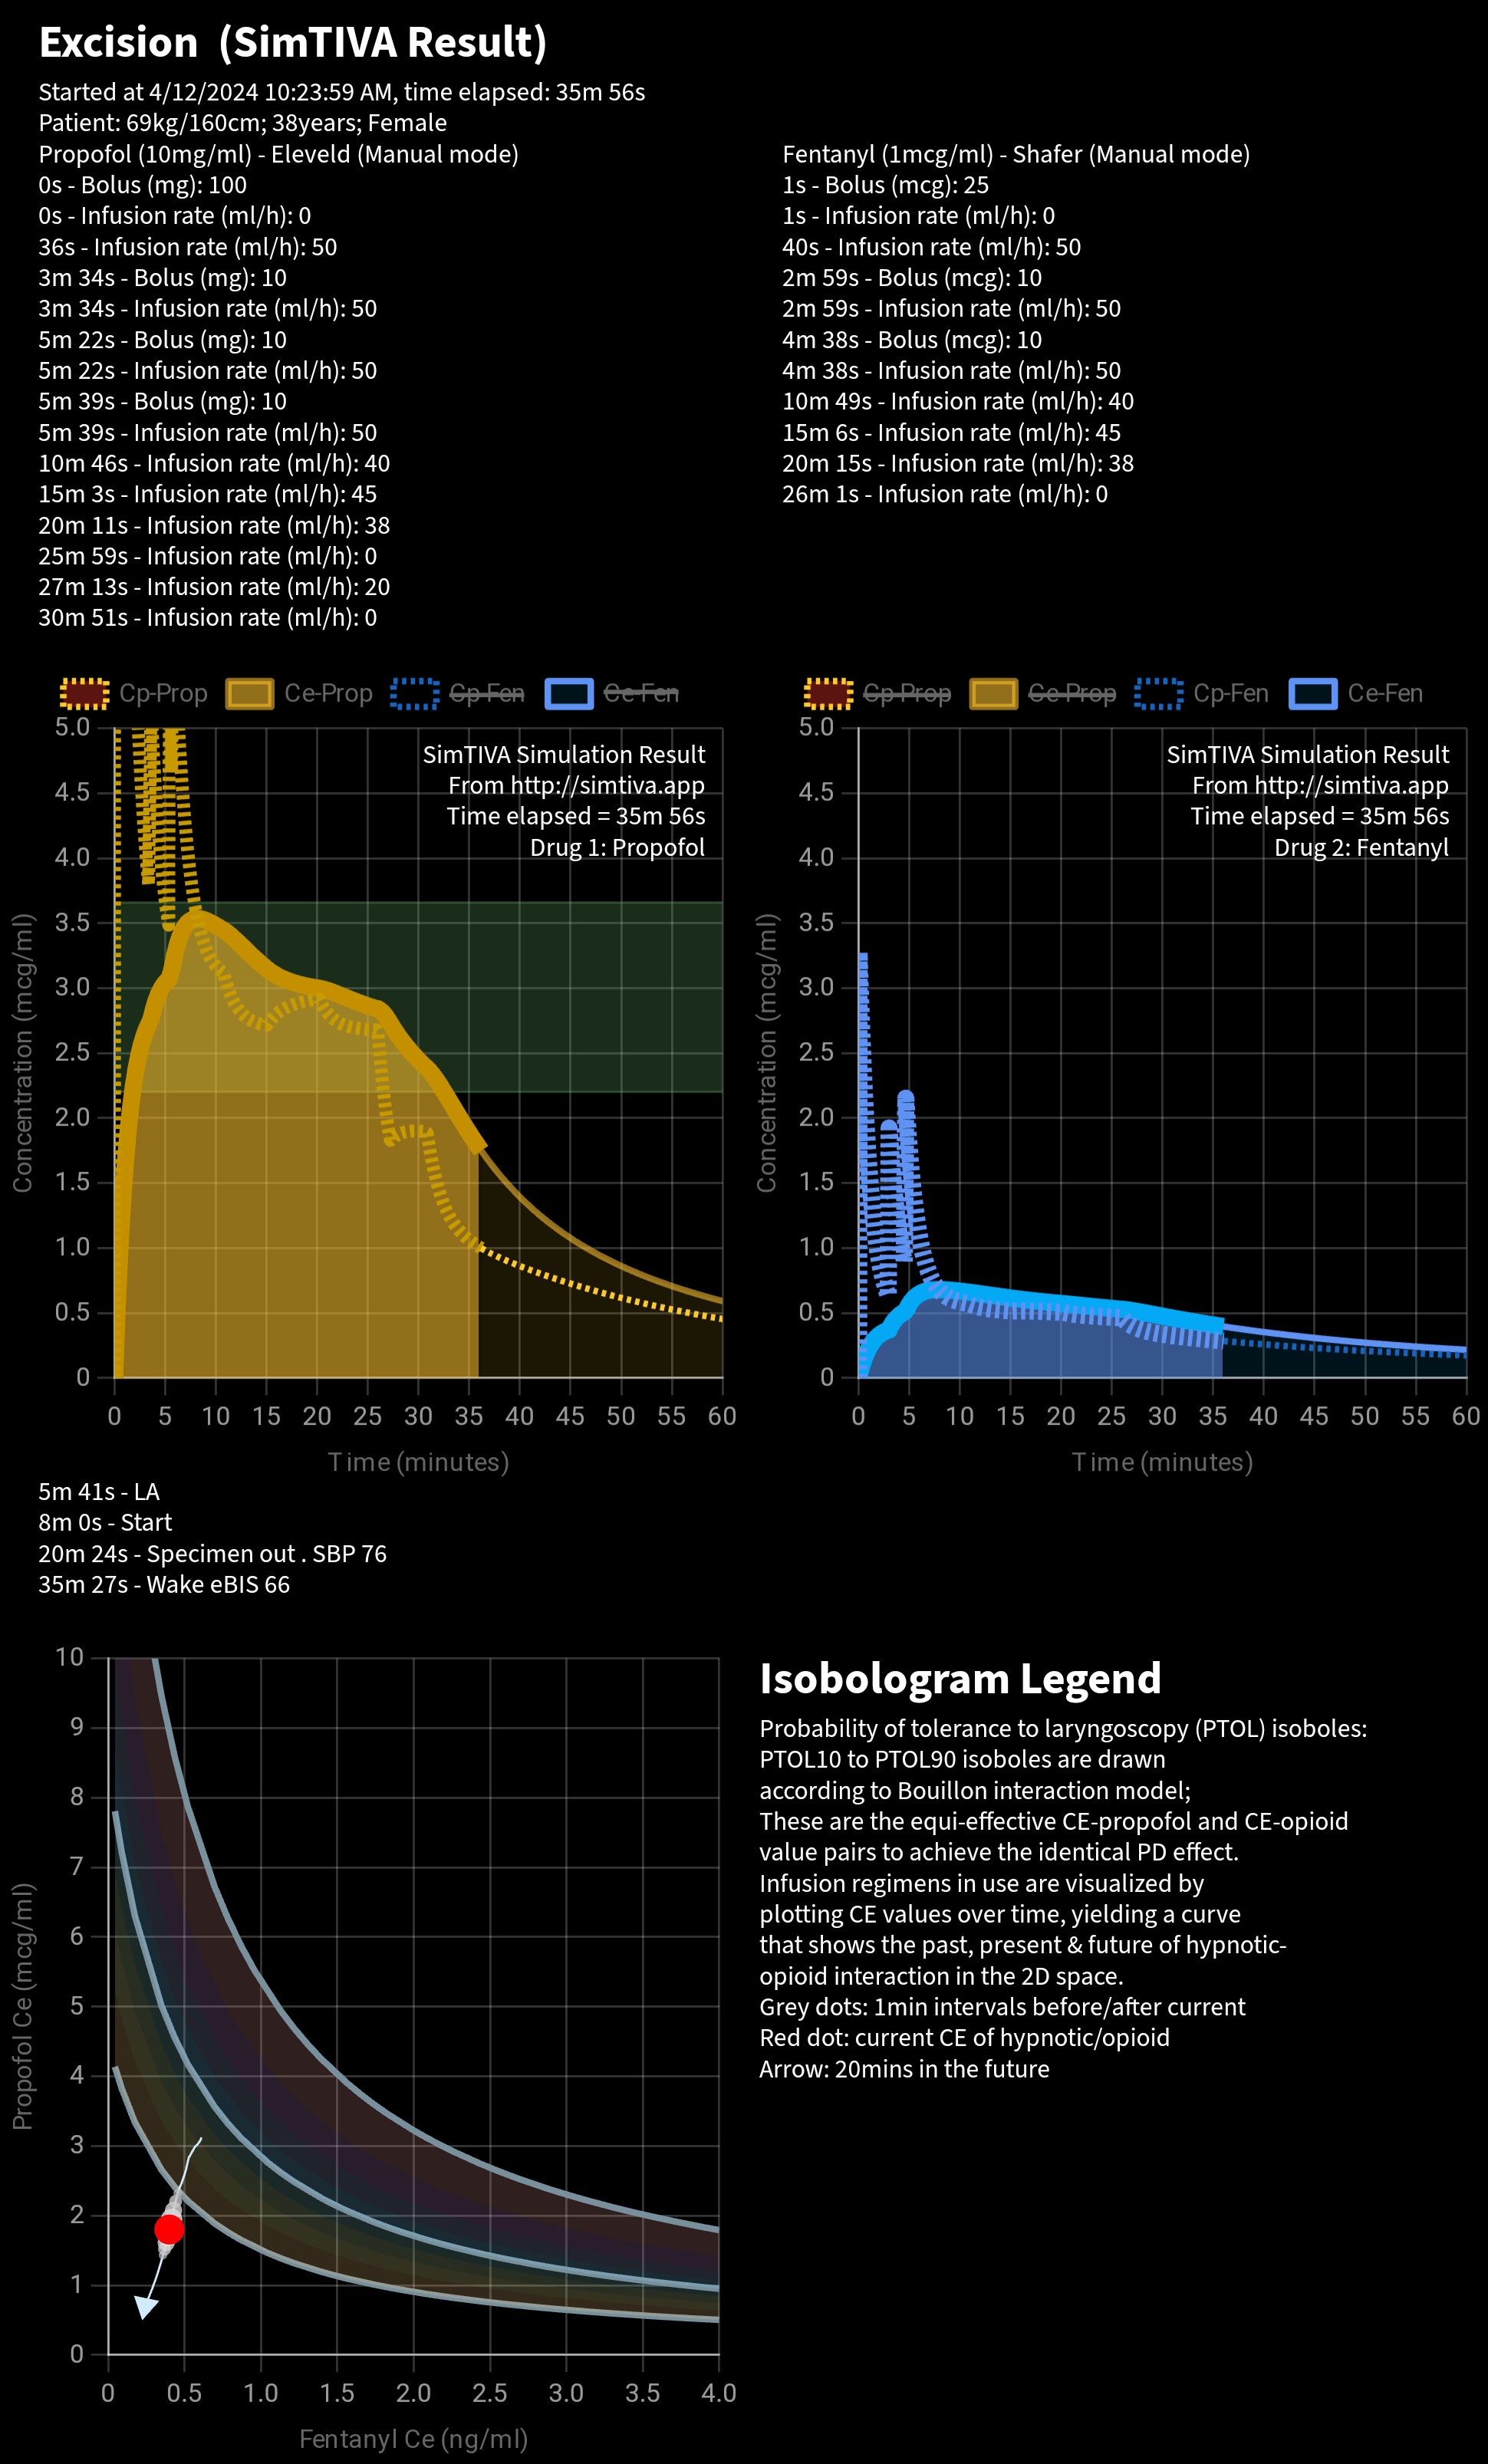
For the Complex (Dual mode), both Propofol and Opioid simulations will be included. The isobologram will be displayed too. An isobologram legend guides the interpretation of the isobologram.
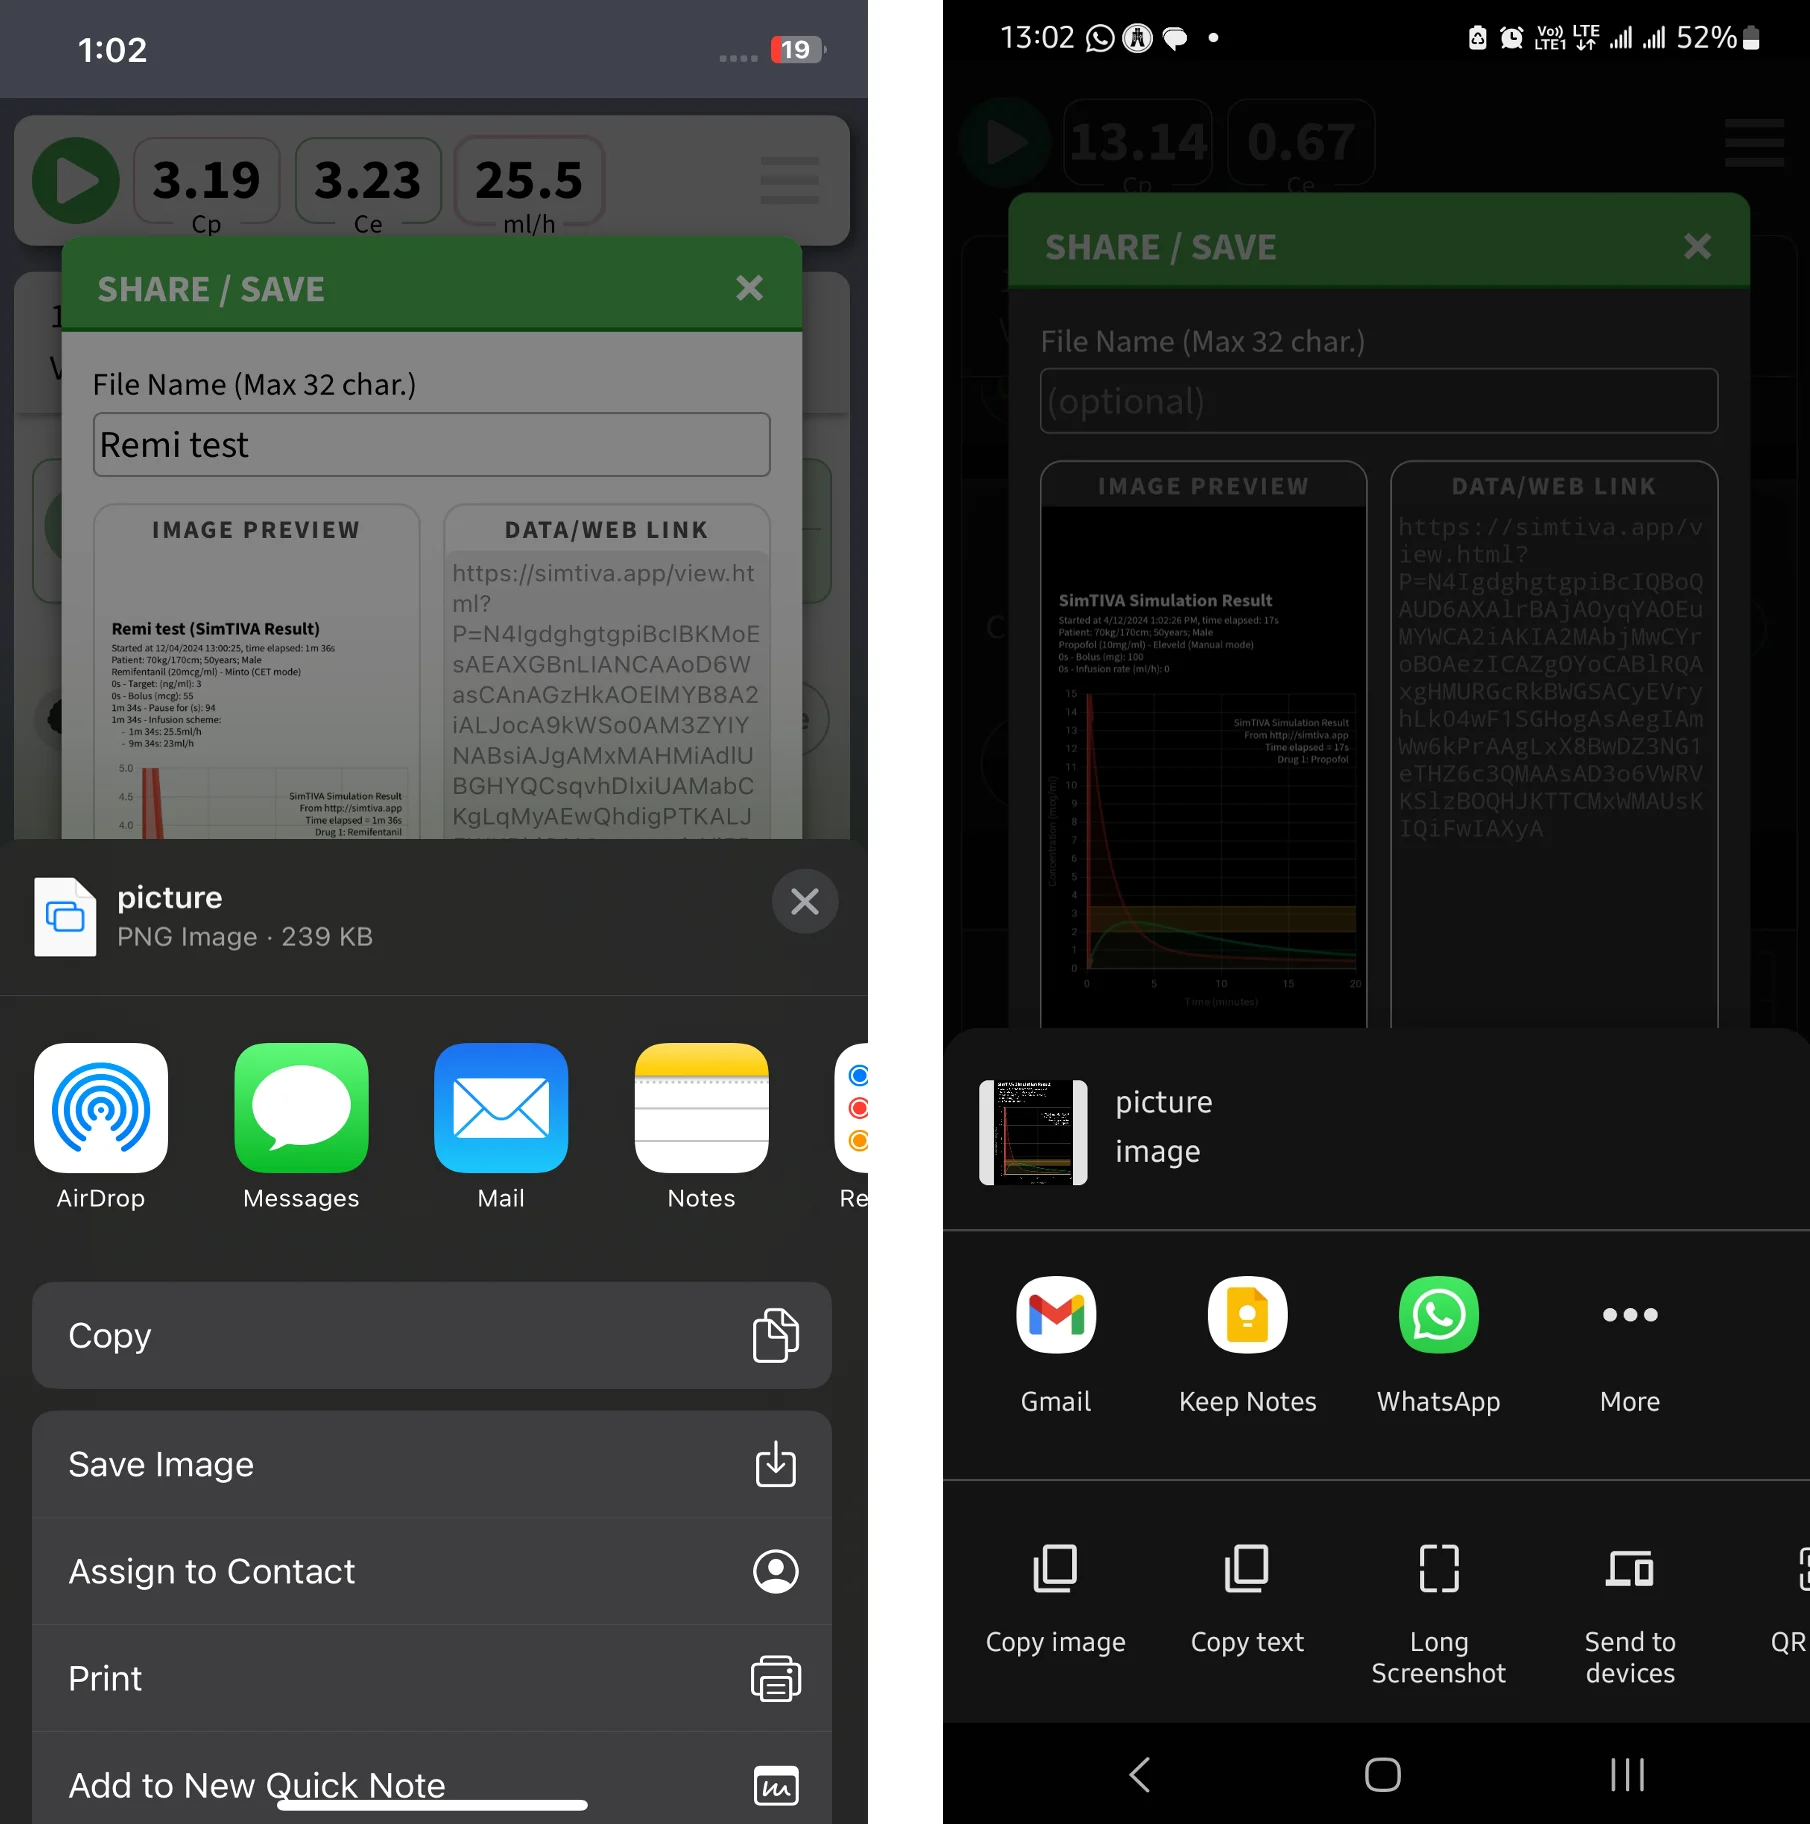
Share via Apps
A convenient feature on mobile devices is that, you can use the "Share" button to share the image or weblink via the app of your choice. Screenshots of iPhone and Android (left and right respectively) are given below.
Share Weblink & SimTIVA Viewer
A copy of current simulation can be shared as a SimFile that can be viewed on the SimTIVA Viewer. All the data in the simulation becomes accessible on the weblink. Other users can then review the case interactively. A website link (weblink) is generated that functions as a SimFile.
You may choose to "Copy" the weblink to clipboard and paste it in another program; or you can "Share" it via apps on mobile devices. In the video demonstration below, a weblink is shared via Whatsapp. Clicking on the link will load the SimFile automatically. The case was a surgery for excision of a lipoma, and the anaesthetic was sedation with propofol with fentanyl. The event notes can also be viewed. You can see from the video, the PK graph of propofol and the drug regimen given, and then you can also review the fentanyl graph and drug regimen. The PD effect estimation can be switched to BIS mode and the CP/CE/Infusion rate/eBIS can be reviewed by dragging the cursor over the main graph using the "Quick View" function. Finally, the Viewer app can go into Fullscreen for a general overview of the case.
Did you know? https://t.co/4zrK2ZezXO has a "share" function that enables easy sharing of simulation. In this video, the case (excision of lipoma under propofol/fentanyl sedation) was shared via WhatsApp & reviewed. Can see the CP/CE/inf/eBIS & enter Fullscreen view for an… pic.twitter.com/ziz6WudDGr
— SimTIVA (@simtiva_app) April 13, 2024
The weblink itself contains all the pharmacokinetic profile required to replay the entire simulation. The weblink to the above video is here.
File Management
Saving/Loading SimFile
First of all, it is worth noting that you do not need to do anything to save SimFile on device. SimTIVA is a web application and utilizes an interface called the "Local Storage API" to manage the simulations that you have run on your device. As you run a simulation, it is automatically saved.
In the Share/Save panel, which can be easily accessed via the Share button, you can type a File Name for easy identification of the SimFile later on.
The "Load File" panel
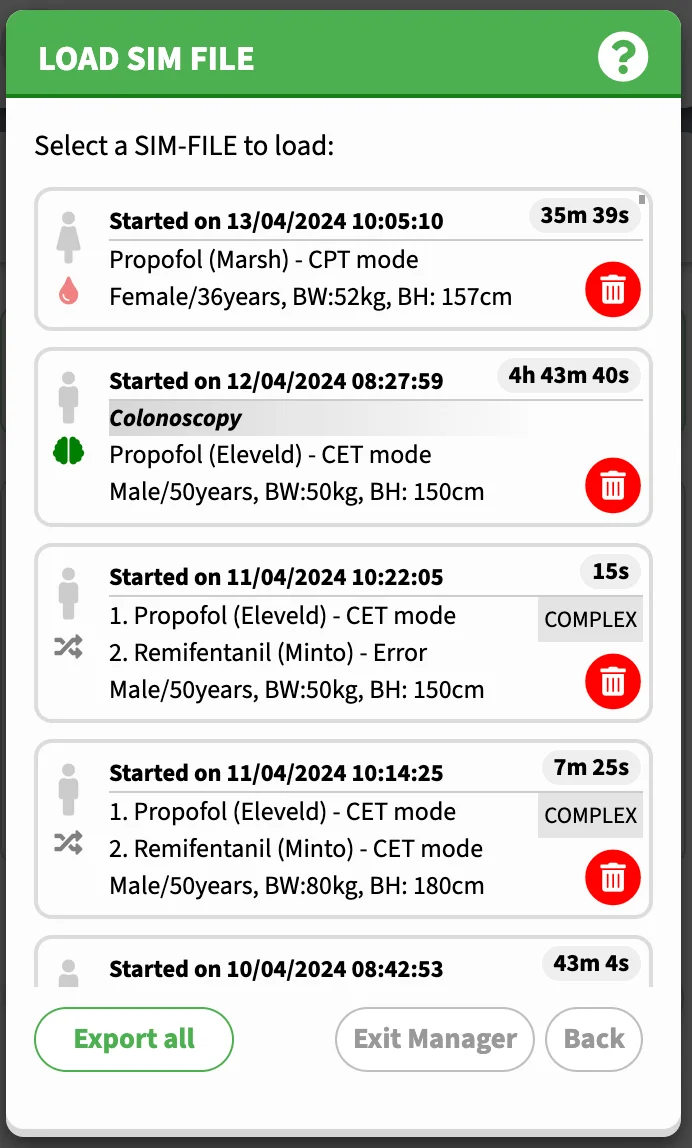
Here is the appearance of the "Load File" Panel:
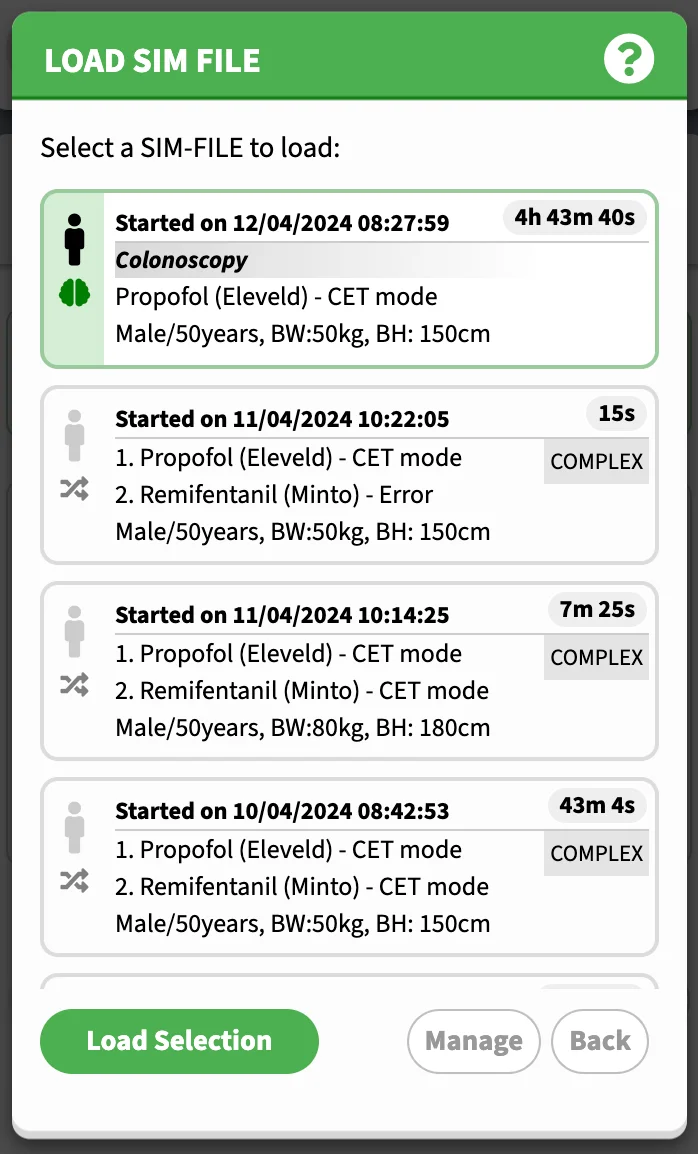
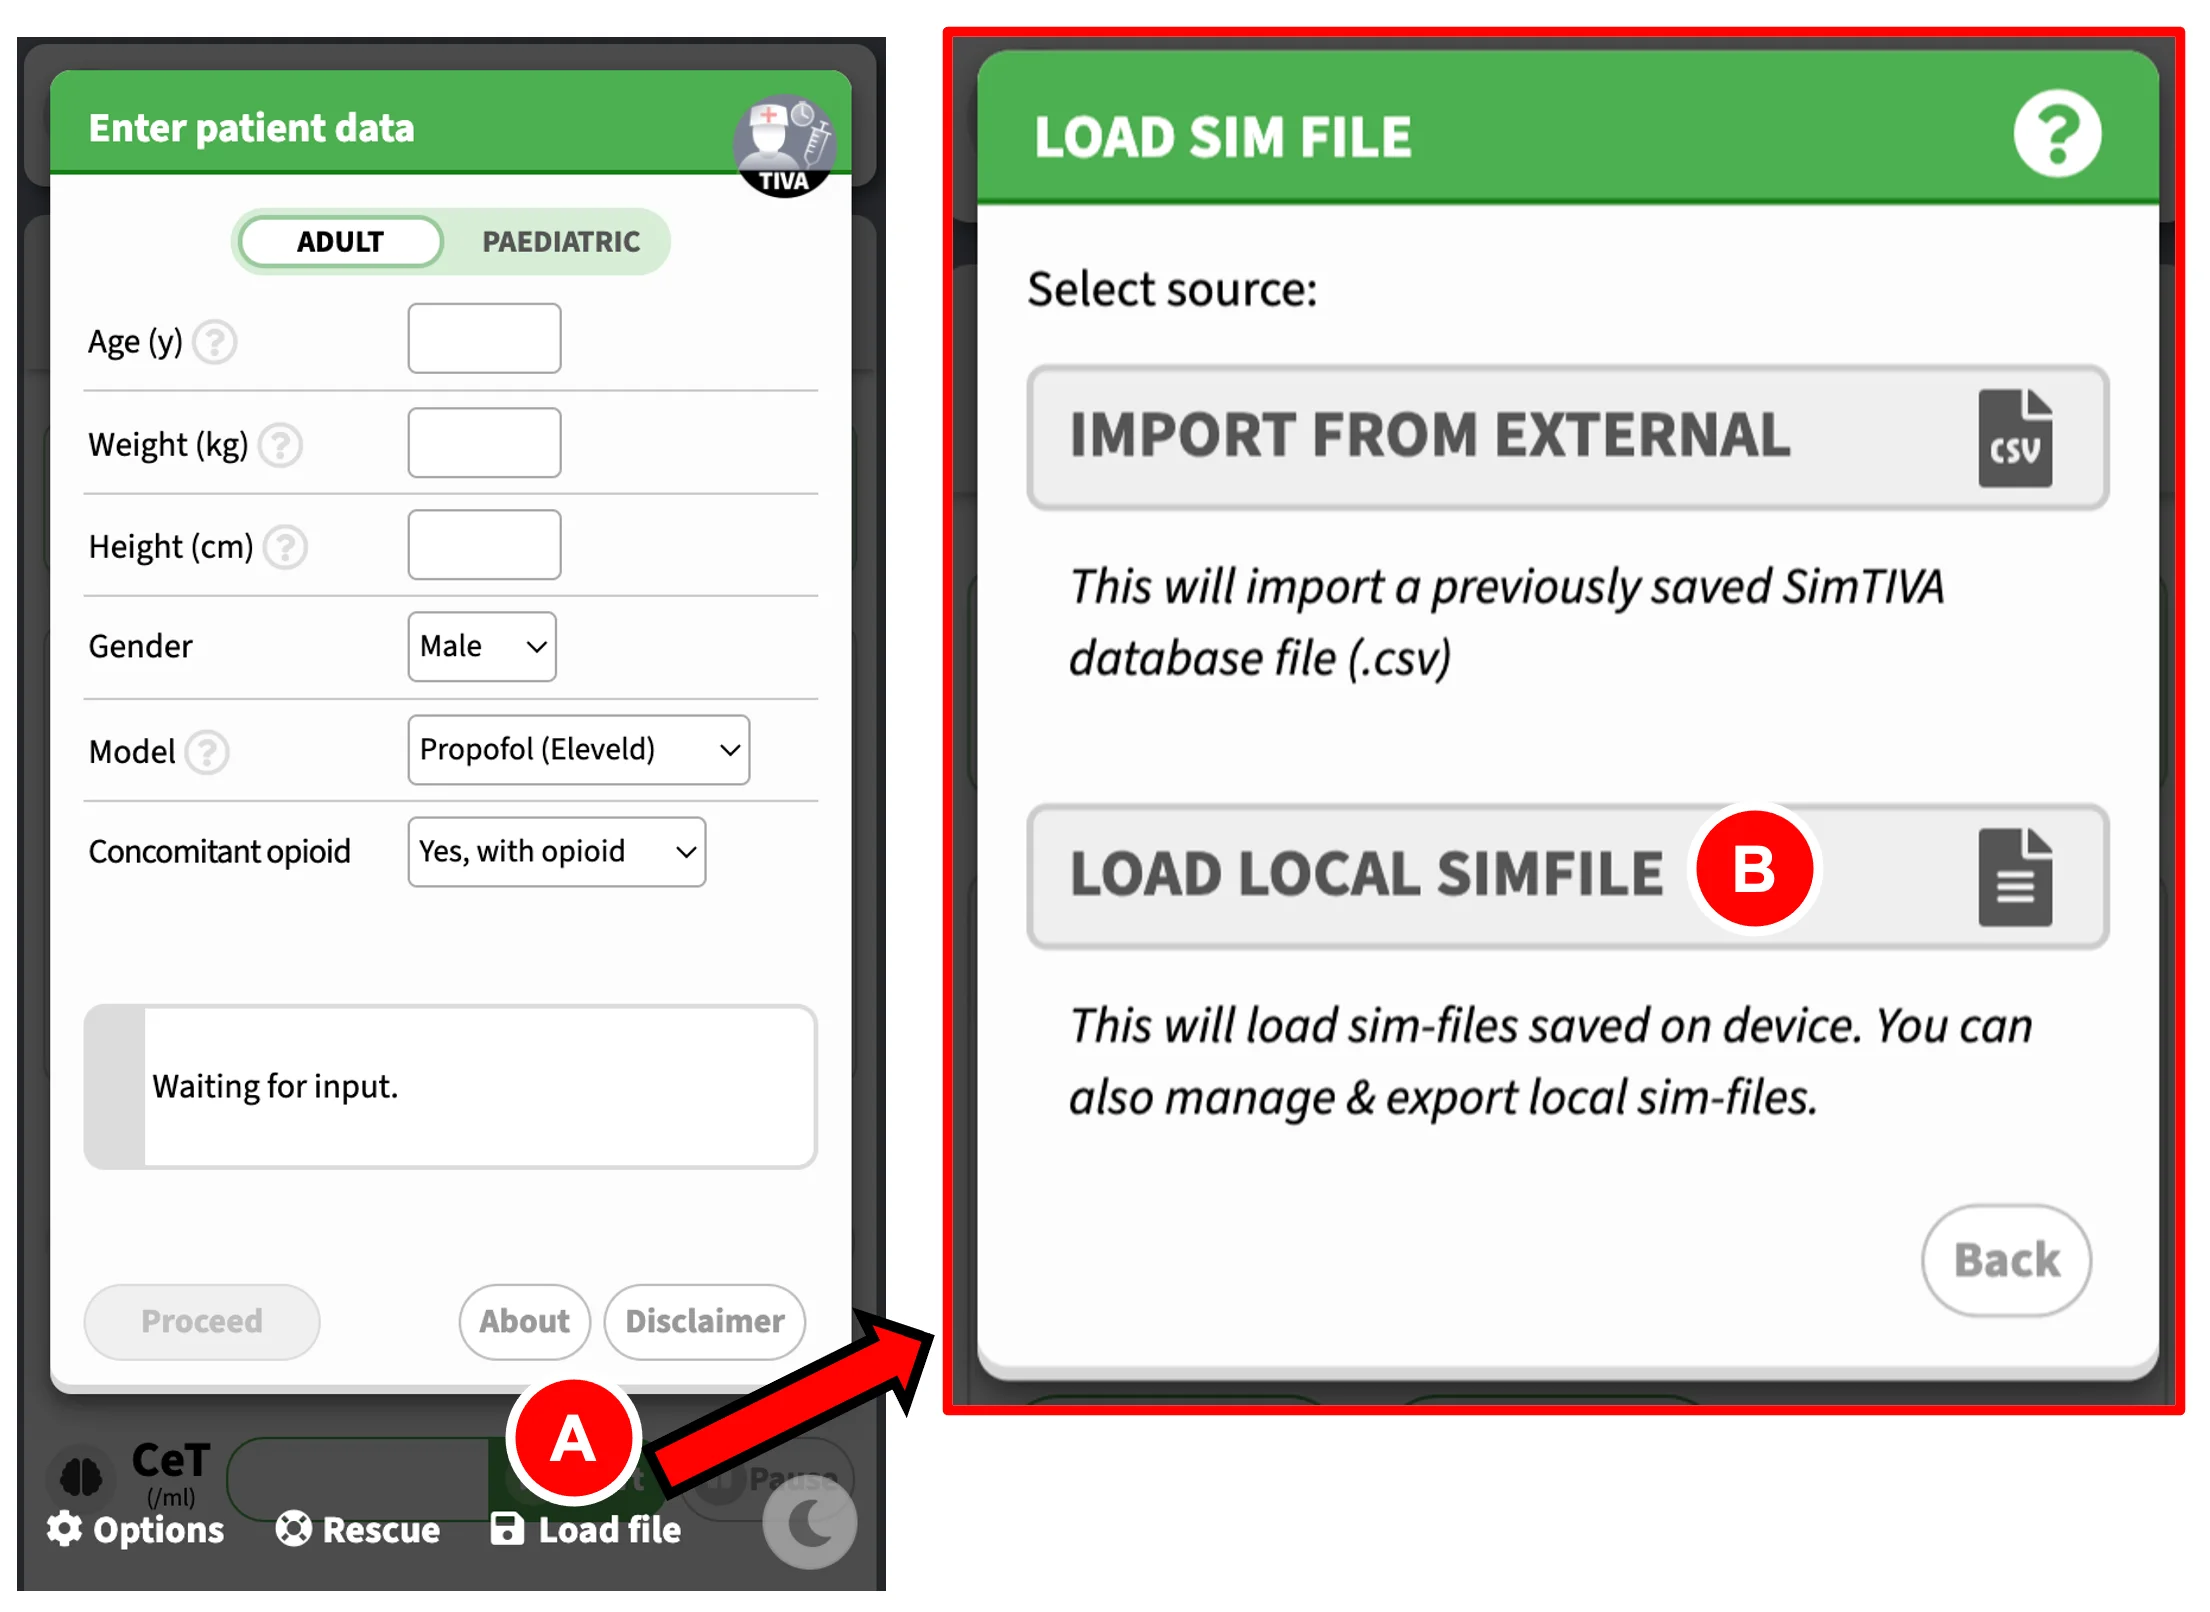
From the first screen, click "Load File" (A), then click "Load Local SimFile" (B). This will take you to the "Load File" panel. A list of previously saved simulations will appear. Choose the desired SimFile and click "Load Selection". After loading, you can choose to "Resume Simulation", see the section below.
Rescue (Rescuing the last-saved SimFile)
Sometimes, accidents can happen. The browser window might have frozen or closed unexpectedly. By clicking "Rescue" on the first screen, the last-saved SimFile will be loaded and the data will be restored. Here you can resume from the last saved time point.
File Management
Deleting a SimFile
In the "Load File" panel, click "Manage". Next to each SimFile item, there will be a Delete icon. Click it to delete a SimFile. Click "Exit Manager" to go back to the initial "Load File" panel.
Exporting database
The entire database of SimFiles can be exported. To perform this action, on the "Load File" Panel, click "Manage", and click "Export All". This will take you to the next screen, where you can enter a file name for the CSV database file, and once you confirm by clicking "Proceed" the file will be saved on to device.
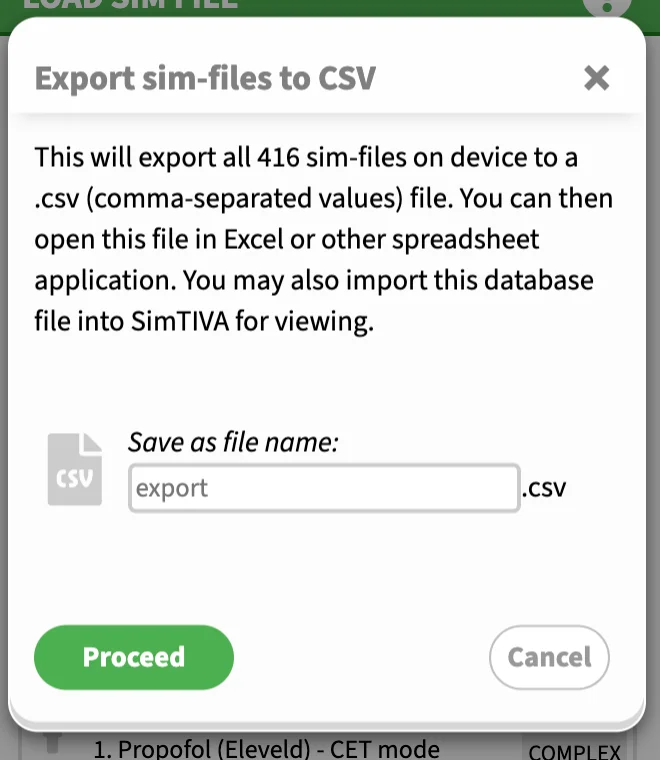
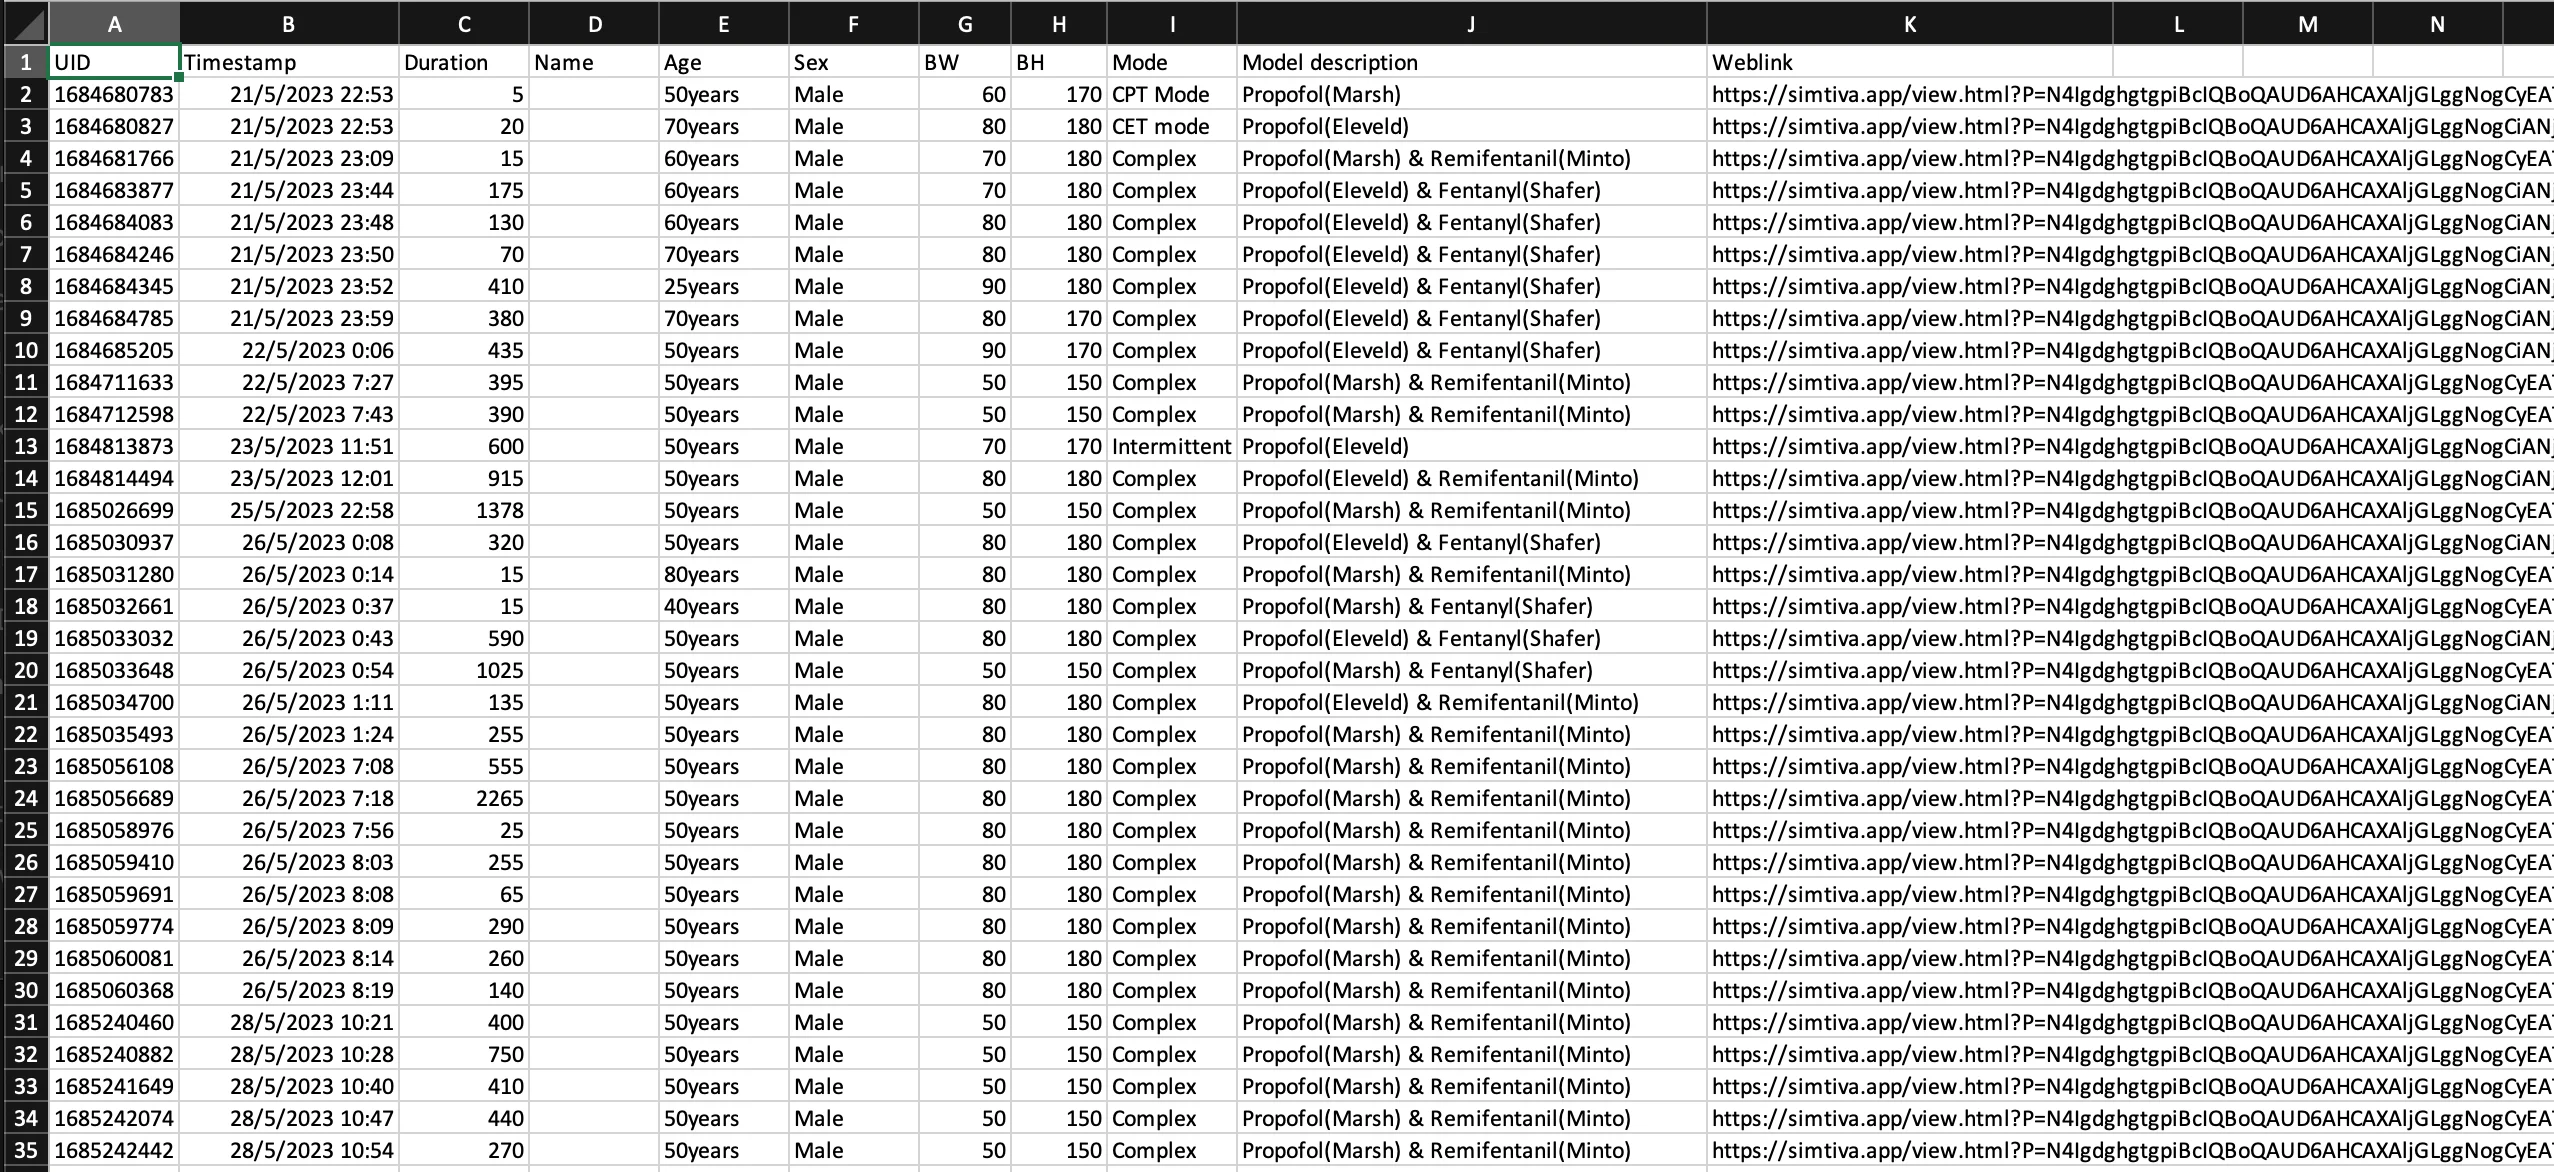
This will generate a CSV file (comma-separated values). The database file can be opened by various spreadsheet programs such as Microsoft Excel or Google Sheets. In the database, each SimFile will be represented by the following data: file name (if any), time, duration, patient details such as age, weight and height, and a weblink attached to each SimFile entry. By opening the corresponding weblink of the case, this will take you to the SimTIVA Viewer app to review the case details.
Also, the CSV file can be loaded into SimTIVA, so that you can use the SimTIVA app to retrieve the specific SimFile case for review. In the SimTIVA interface, it is possible to "Resume" from this previous case. See the sections below for details on how to load an external database CSV file and how to resume simulations.
Loading from external database
Suppose a database is exported using the "Export" Function as outlined above. You will have the file saved on disk. It is possible to load this CSV file into SimTIVA and retrieve all the recorded SimFiles stored there. From the first screen, choose "Load File", and then "Import from external database". Use the file selection box to select the file on device to load. Select the desired SimFile entry and click "Load Selection". Watch the video below for a demonstration.
December Updates (1)https://t.co/4zrK2ZezXO has improved its import/export function. U may export your data to a .CSV file & import it back to SimTIVA from the Load screen.
— SimTIVA (@simtiva_app) December 8, 2023
U may also review individual simfiles by opening the .CSV file in a spreadsheet app. pic.twitter.com/sVhgN3HLOm
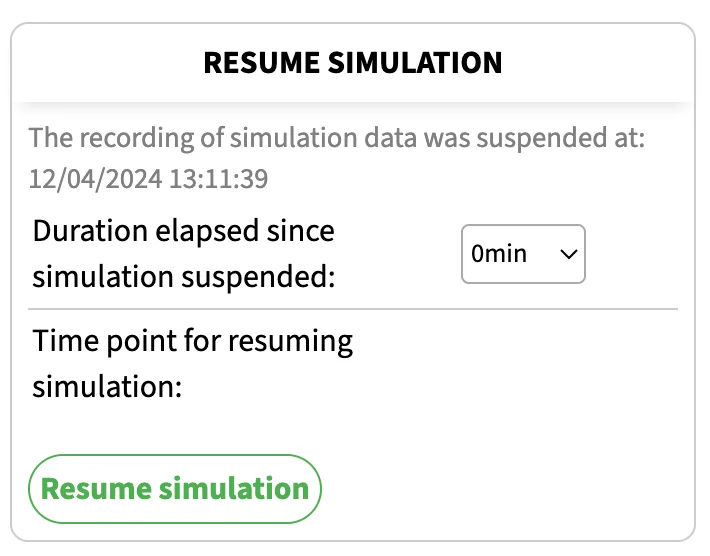
Resuming from SimFile
A SimFile can be loaded from three sources. One, by clicking "Rescue" on the initial screen and it will load the last-saved SimFile. Two, by loading from device locally. Three, by loading from external database. These are covered in the previous sections.
After loading of the SimFile, you can view the data in the simulation such as CP/CE/Infusion scheme. You may also have the option to resume from the point when the simulation was suspended. You can enter the duration elapsed since the simulation was last suspended. You can continue with the case like a normal SimTIVA simulation.